JP Morgan Chase & Co (JPM) - 15th May 2025 | @ 83 Days | + 11.15%
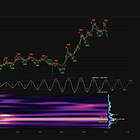
Last trade: + 11.15% | 'B' class signal detected in JP Morgan Chase & Co (JPM). Running at an average wavelength of 83 days over 15 iterations since December 2021. Currently peaking.
ΣL Cycle Summary
We return to this remarkably stationary periodic feature in JPM as an analogy for the wider feature on US indices and many similar stocks around 80 days (notionally the Hurst 80 day nominal wave). Downgrading it slightly to a ‘B’ category due to a touch of recent modulation, this may well prove to be transient as we approach the next trough in late June. Amplitude has picked up quite a bit over the last few iterations, seen most clearly in the high-pass filtered price below. All in all an excellent cycle, highly stationary over 15+ samples since December 2021 and one to keep a very close eye on as a barometer. Watch for this feature in other stocks (AAPL, GS, V come to mind) and, of course, in the wider averages.
Trade Update
Summary of the most recent trade enacted with this signal and according to the time prediction detailed in the previous report for this instrument, linked below.
Type: Buy - JP Morgan and Chase (JPM) 20th March 2025
Entry: 20th March 2025 @ 239.00
Exit: 14th May 2025 @ 265.64
Gain: 11.15%


