

ΣL Japanese Yen Composite - 3rd May 2024 | @ 75 Days | + 4.3%
Last trade: + 4.30% | 'B' class signal: Sigma-L Japanese Yen Composite (GBP/EUR/CAD/AUD/USD vs JPY). Average wavelength of 75 days over 16 iterations since December 2020. Currently hard down

ΣL Cycle Summary
We have held off the update (due 24th April) for JPY pairs due to the unprecedented intervention by the Japanese state at the peak of the component recently. Serving only to increase amplitude and not timing of a periodic feature, macro and news events can, of course, be sudden and unexpected. Generally they will increase volatility (amplitude) and move in the direction of the underlying periodic influence, in this case it was toward a peak of this wave around 75 days. The component is now hard down, having established the peak and is maintaining the increased amplitude so far. The next trough for JPY pairs for this wave in particular is due mid-late May. Within our composite the Dollar outperformed against the Yen (6.07%) whilst the British Pound lagged, recording a gain of 3.03% over the trade period.
Trade Update
Summary of the most recent trade enacted with this signal and according to the time prediction detailed in the previous report for this instrument, linked below.
Type: Buy - ΣL Japanese Yen Composite 11th March 2024
Entry: 11th March, 2024
Exit: 24th April, 2024
For a composite analysis, each constituent’s respective gain over the period is displayed, in descending order. The average of the constituent gain is also shown.
Constituent Gain:
USDJPY (6.07%)
AUDJPY (4.33%)
CADJPY (4.33%)
EURJPY (3.75%)
GBPJPY (3.03%)
Composite Average Gain:
4.30%
Before and After
Signal comparison between our last report and the current time, in chart format.

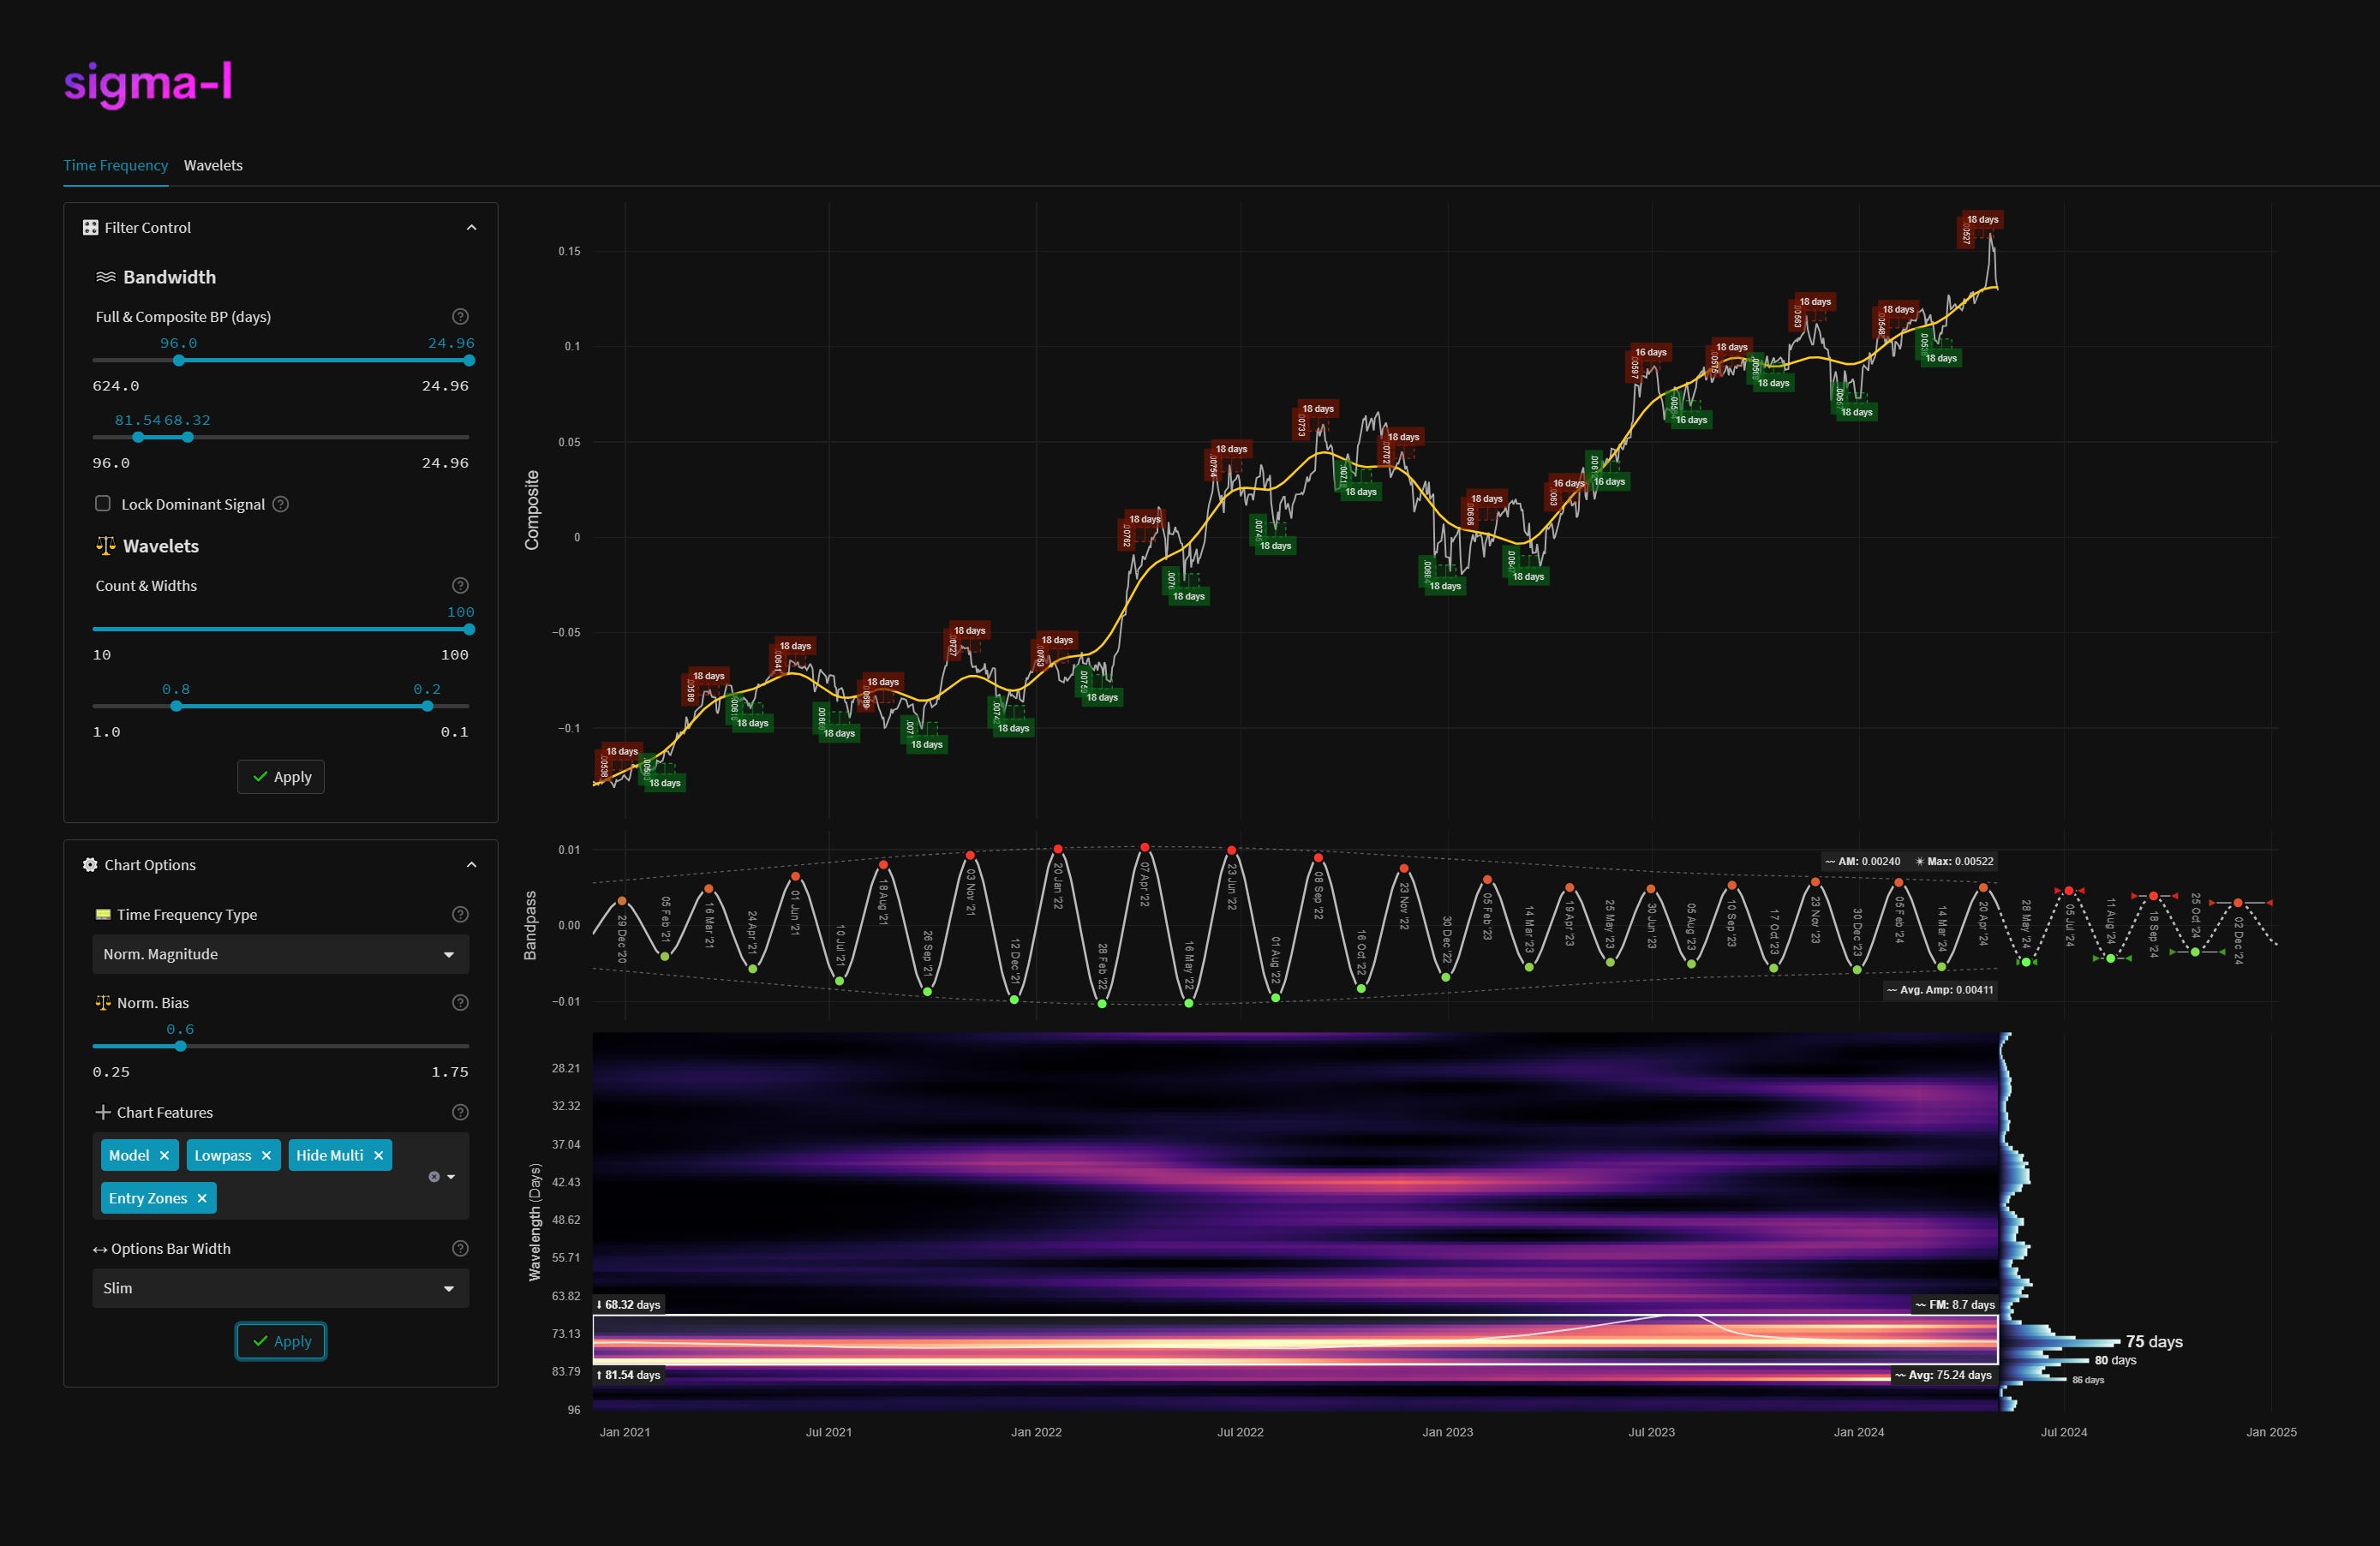
Time Frequency Analysis
Time frequency charts (learn more) below will typically show the cycle of interest against price, the bandpass output alone and the bandwidth of the component in the time frequency heatmap, framed in white. If a second chart is displayed it will usually show high-passed price with the extracted signal overlaid for visual clarity.