

Ethereum: Hurst Cycles - 11th November 2022
After a tumultuous few days in crypto, which likely marks the end of the 18 month component, we look at Ethereum and the outlook over the next few months

Tools required: Nominal Model | FLD | FLD Trading Strategy | FLD Trading Strategy (Advanced) | Principle of Nominality | Underlying Trend
Analysis Summary
Back in July this year we anticipated a peak of the 20 week component in Ethereum and some further falls into what is likely to be the 18 month nominal low, occurring soon. We ruled out the possibility of the 18 month nominal low forming in June and regarded underlying trend as down until late October/early-mid November.
From 26th July Report:
When we shift resolution to a weekly chart (long term, below) the placement of the 20 week component becomes less relevant and the 40 week component, which undoubtedly formed it’s last low around March, is prevalent. If we take the price low on 24th January as the most extreme modulation of the 40 week component we see that only 26 weeks have elapsed since that low. This pretty much rules out the possibility of the 18 month component low forming in June or July.
Price is now around 17 months along the phase of the 18 month component with the smaller degree components also beginning to trough. The 40 week VTL is a line in the sand for confirmation that the 18 month component has occurred and will likely be crossed in the next month or two.
As in Bitcoin, the longer term picture is as yet a little unclear. The position of the 54 month nominal low in early 2020 will now come under scrutiny as the first smaller components of the next 18 month component emerge over the coming weeks. In a similar manner to Bitcoin, if ETH were to test the peaks around 4000-4500 within the duration of this next 40 week component, due to peak around the end of the first quarter 2023, then the more bullish scenario will emerge: That bullish scenario is predicated on the 54 month component occurring in December 2018 and not in 2020, as we have currently phased below.
Our current bias is for the current phasing, with the larger component low coming in the first half of 2024. It will likely be clear which of the two biases will be right by the end of the first quarter 2023 and we can adjust in a nimble fashion.
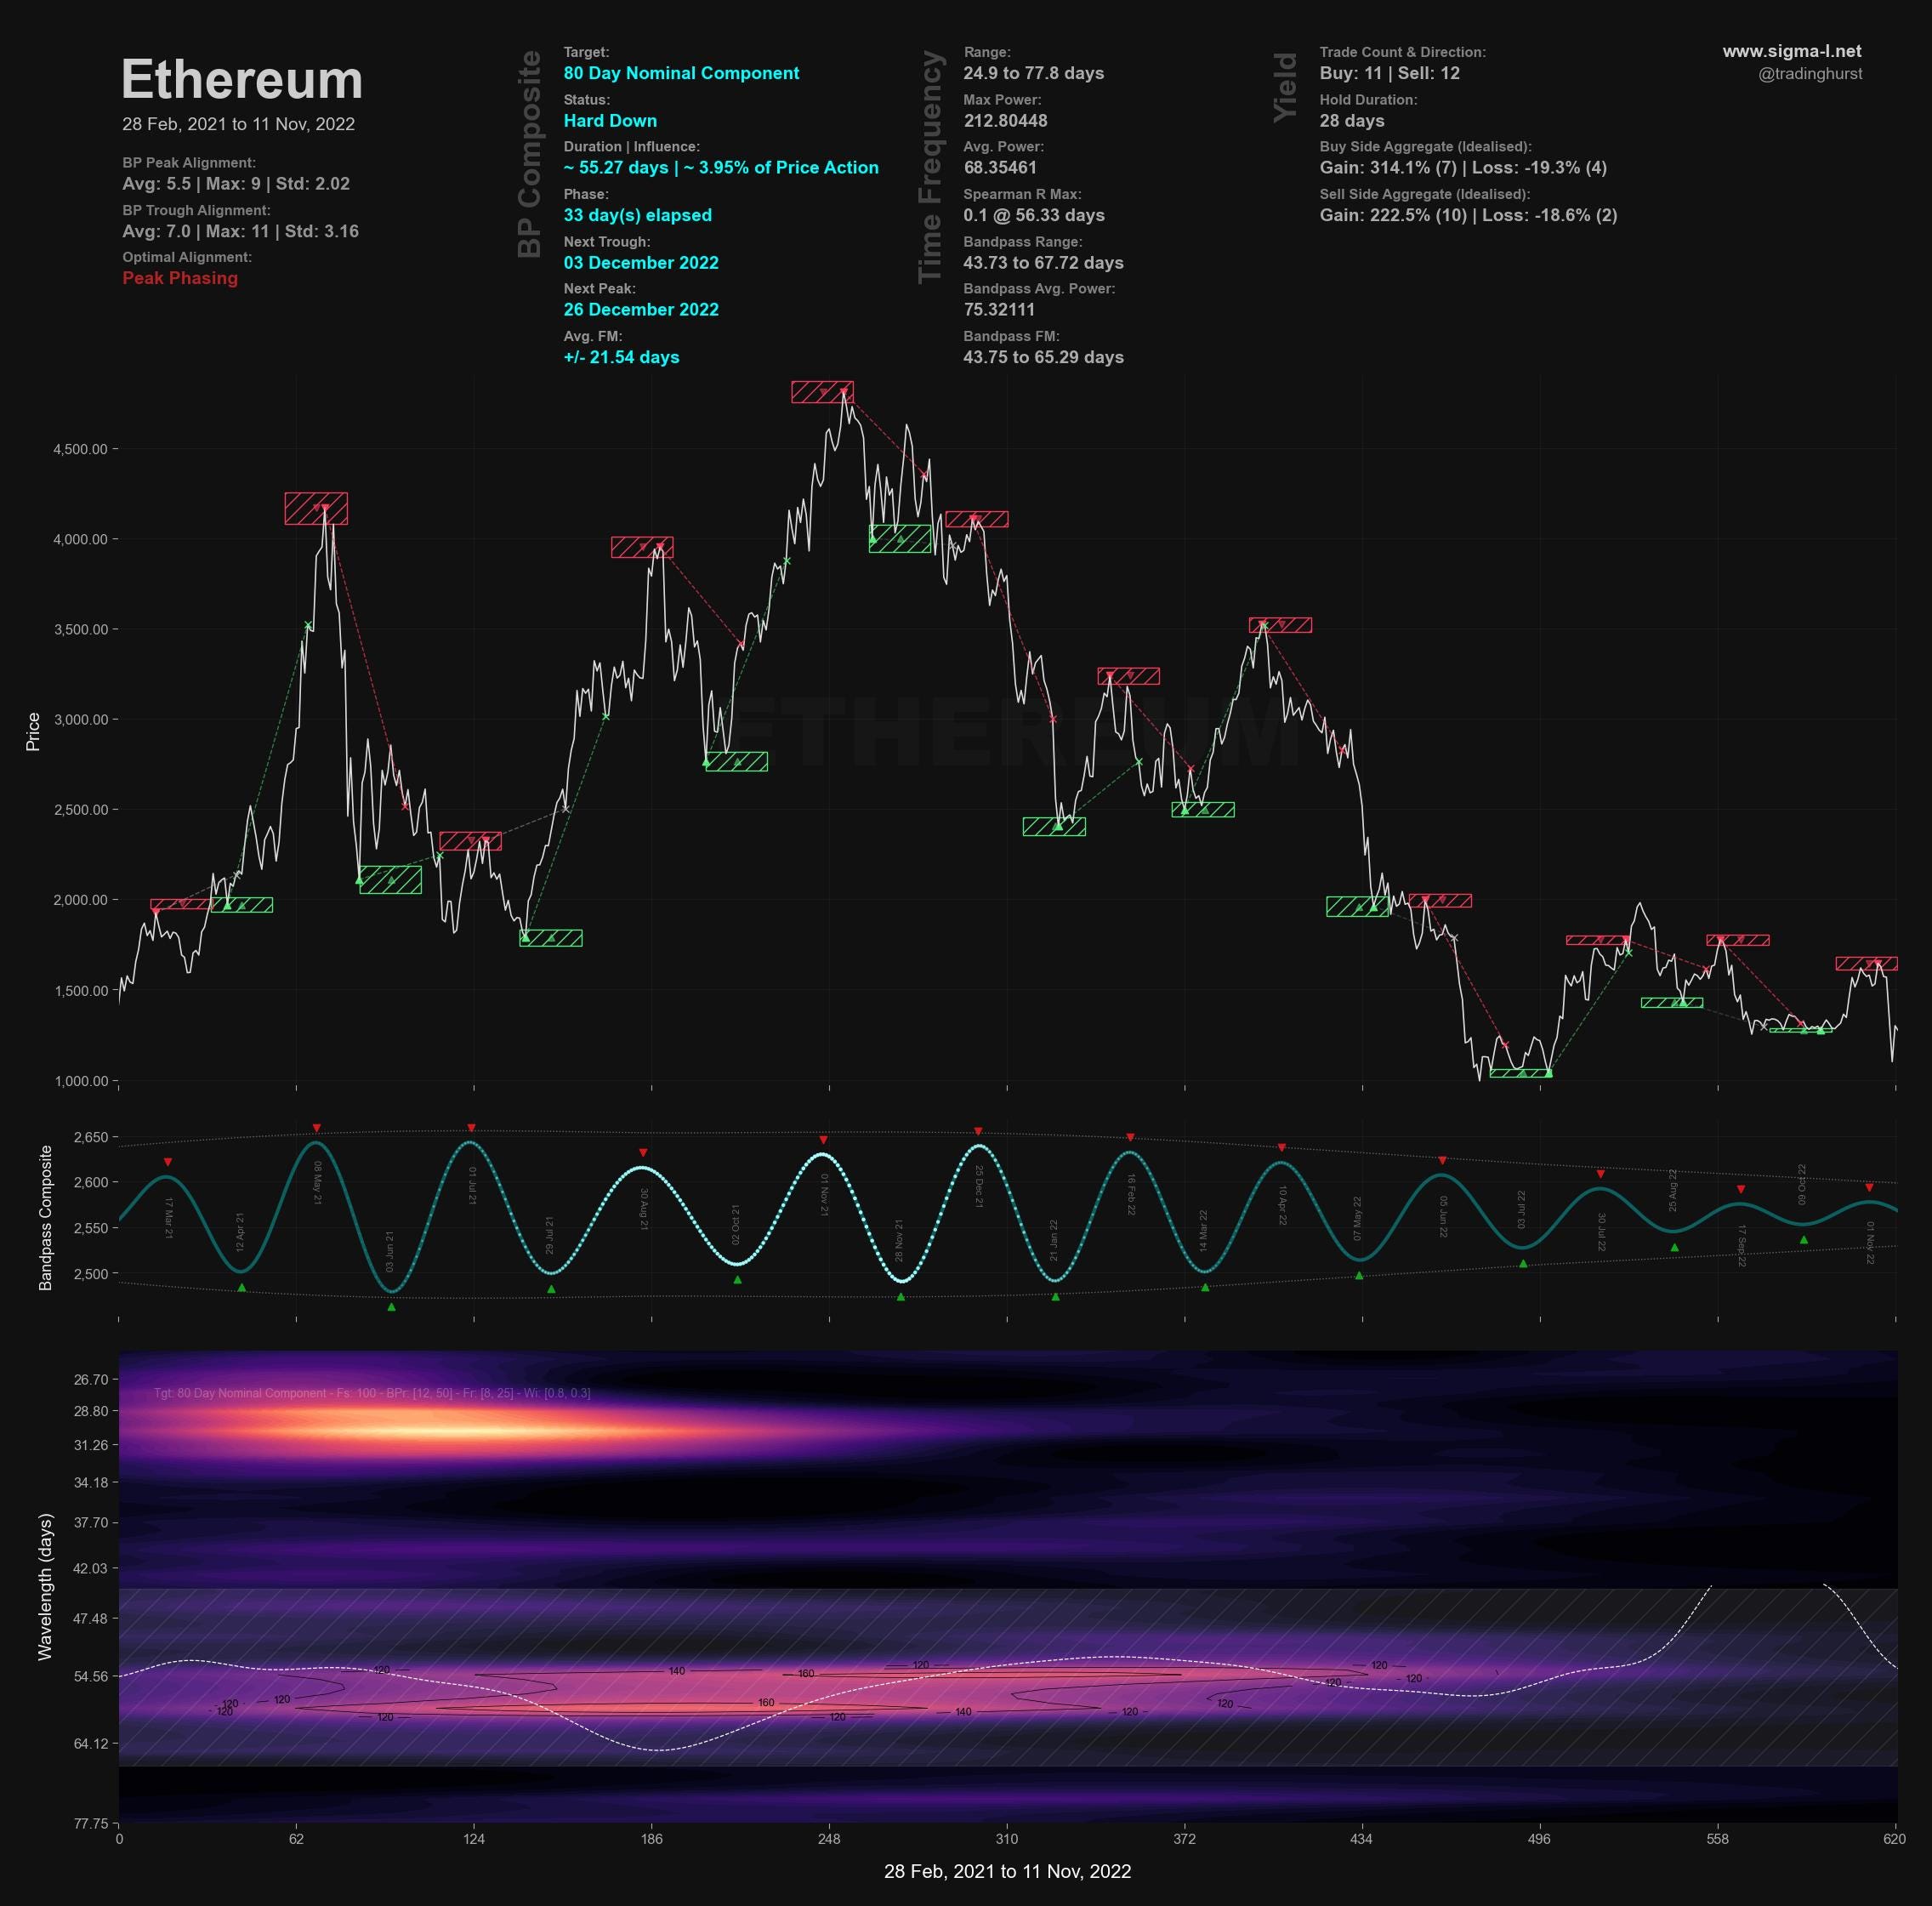
At the medium term price found clear resistance at the 20 week FLD and generally around the 40 week downward VTL prior to the macro fuelled collapse of the last few days. The 20 week component from June has been grinding sideways for a few months, the case in most cryptocurrency, as price finds a longer term bottom. This has attenuated the 80 day component but, as shown below in the time frequency analysis, we can make a very good estimation from extrapolation of the average wavelengths.
The estimation brings with it a margin of error equal to the wavelength of a 40 day component (around 28 days). Sentient trader analysis suggests one more 20 day component to come but overall we are well within the nest of lows for the 18 month component and should be alert for buying opportunities.
Phasing Analysis
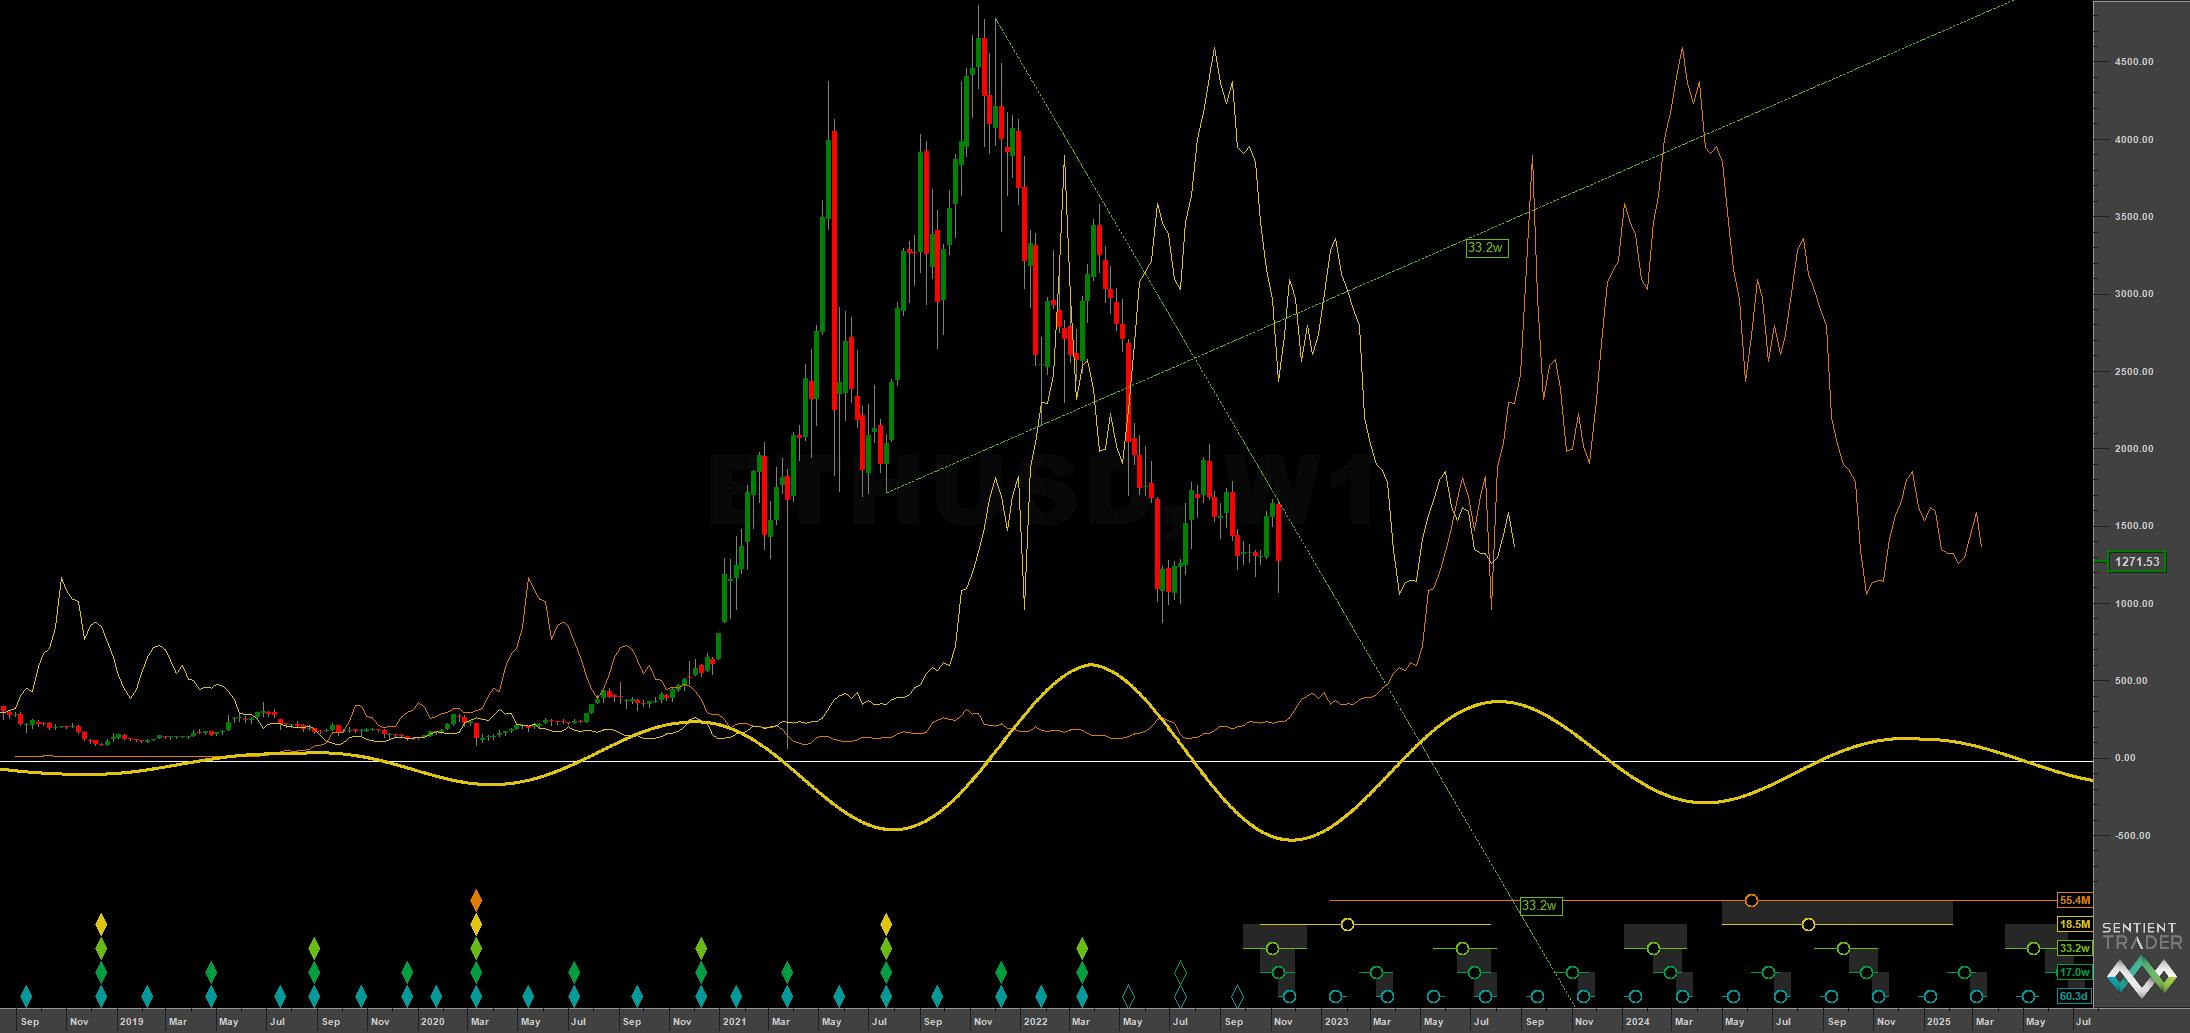
Long Term
Components greater than and including the 18 month nominal cycle
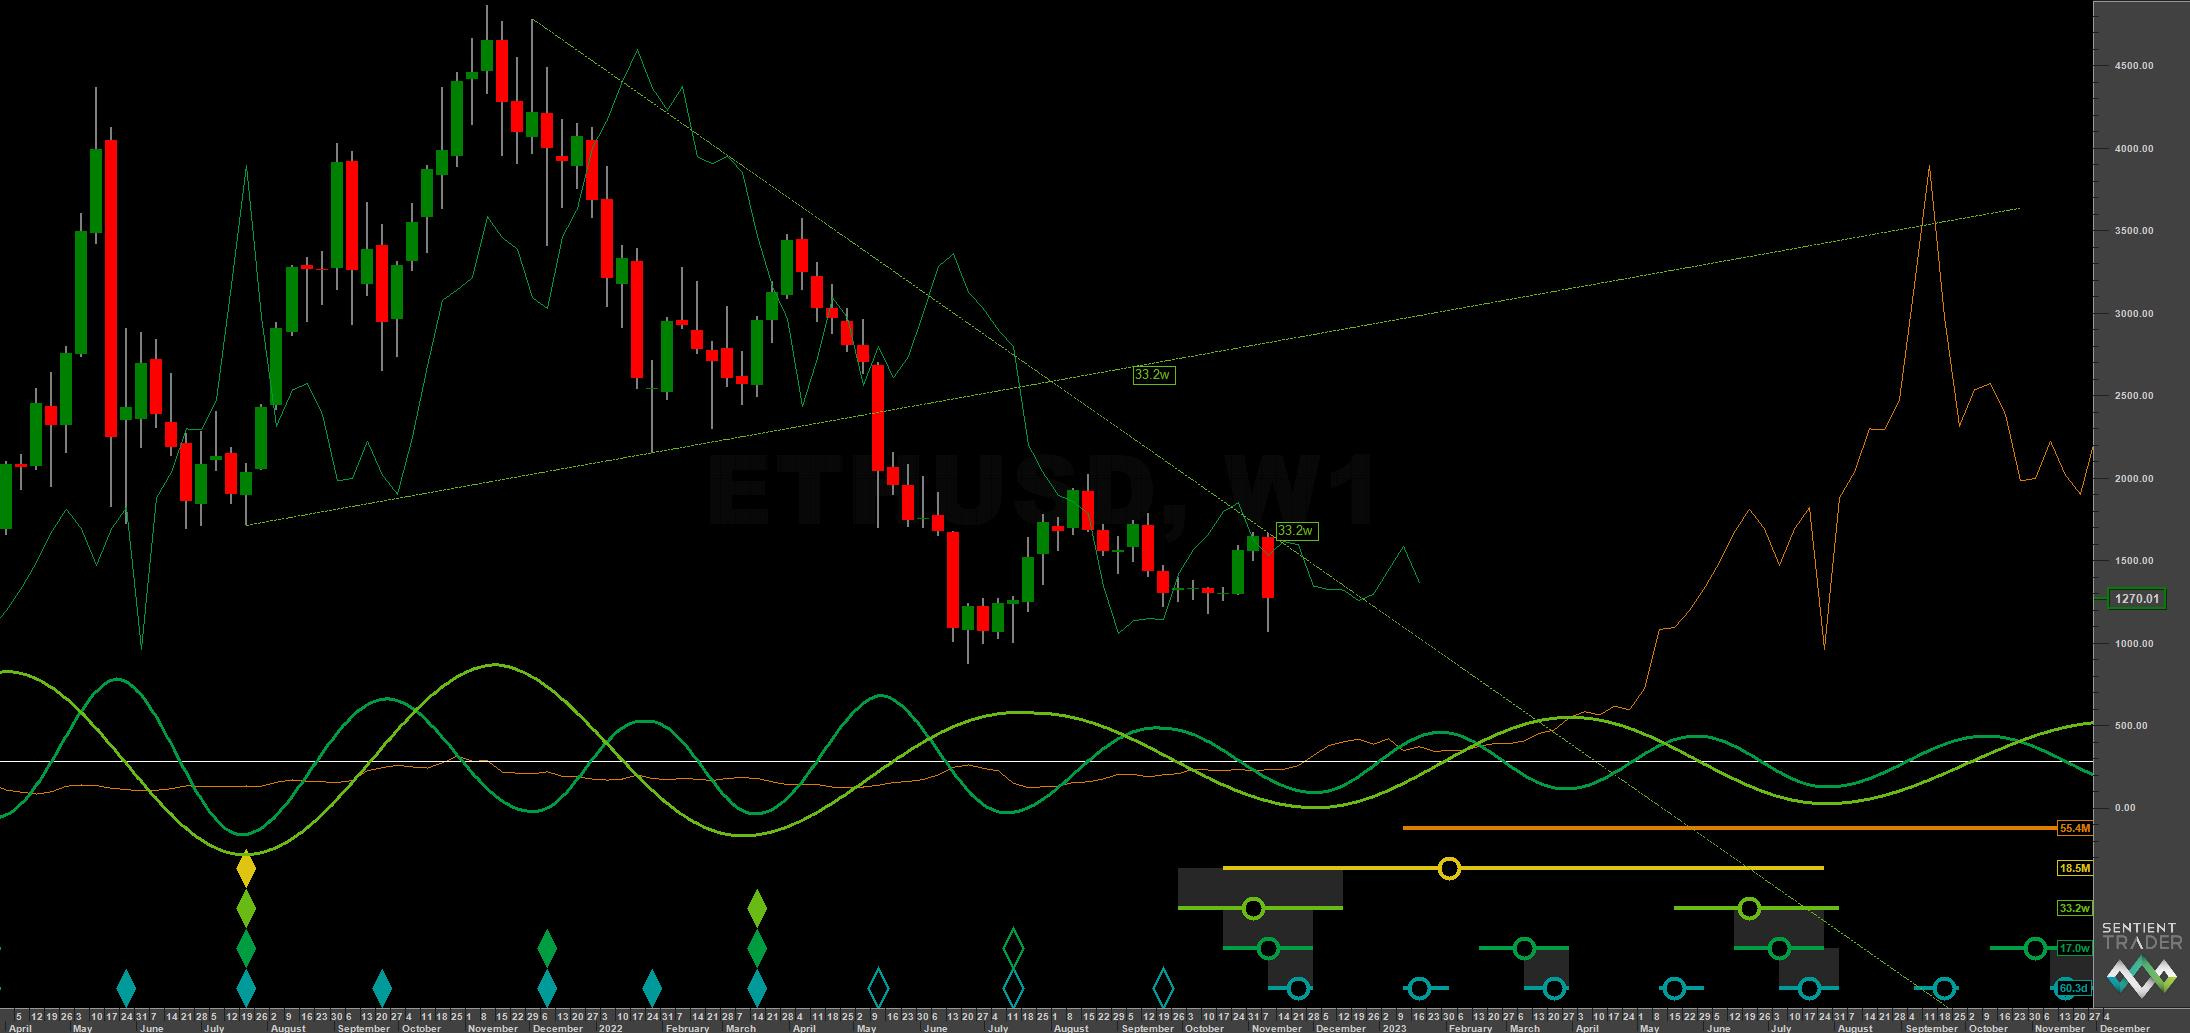
Medium Term
Components less than and including the 18 month nominal cycle
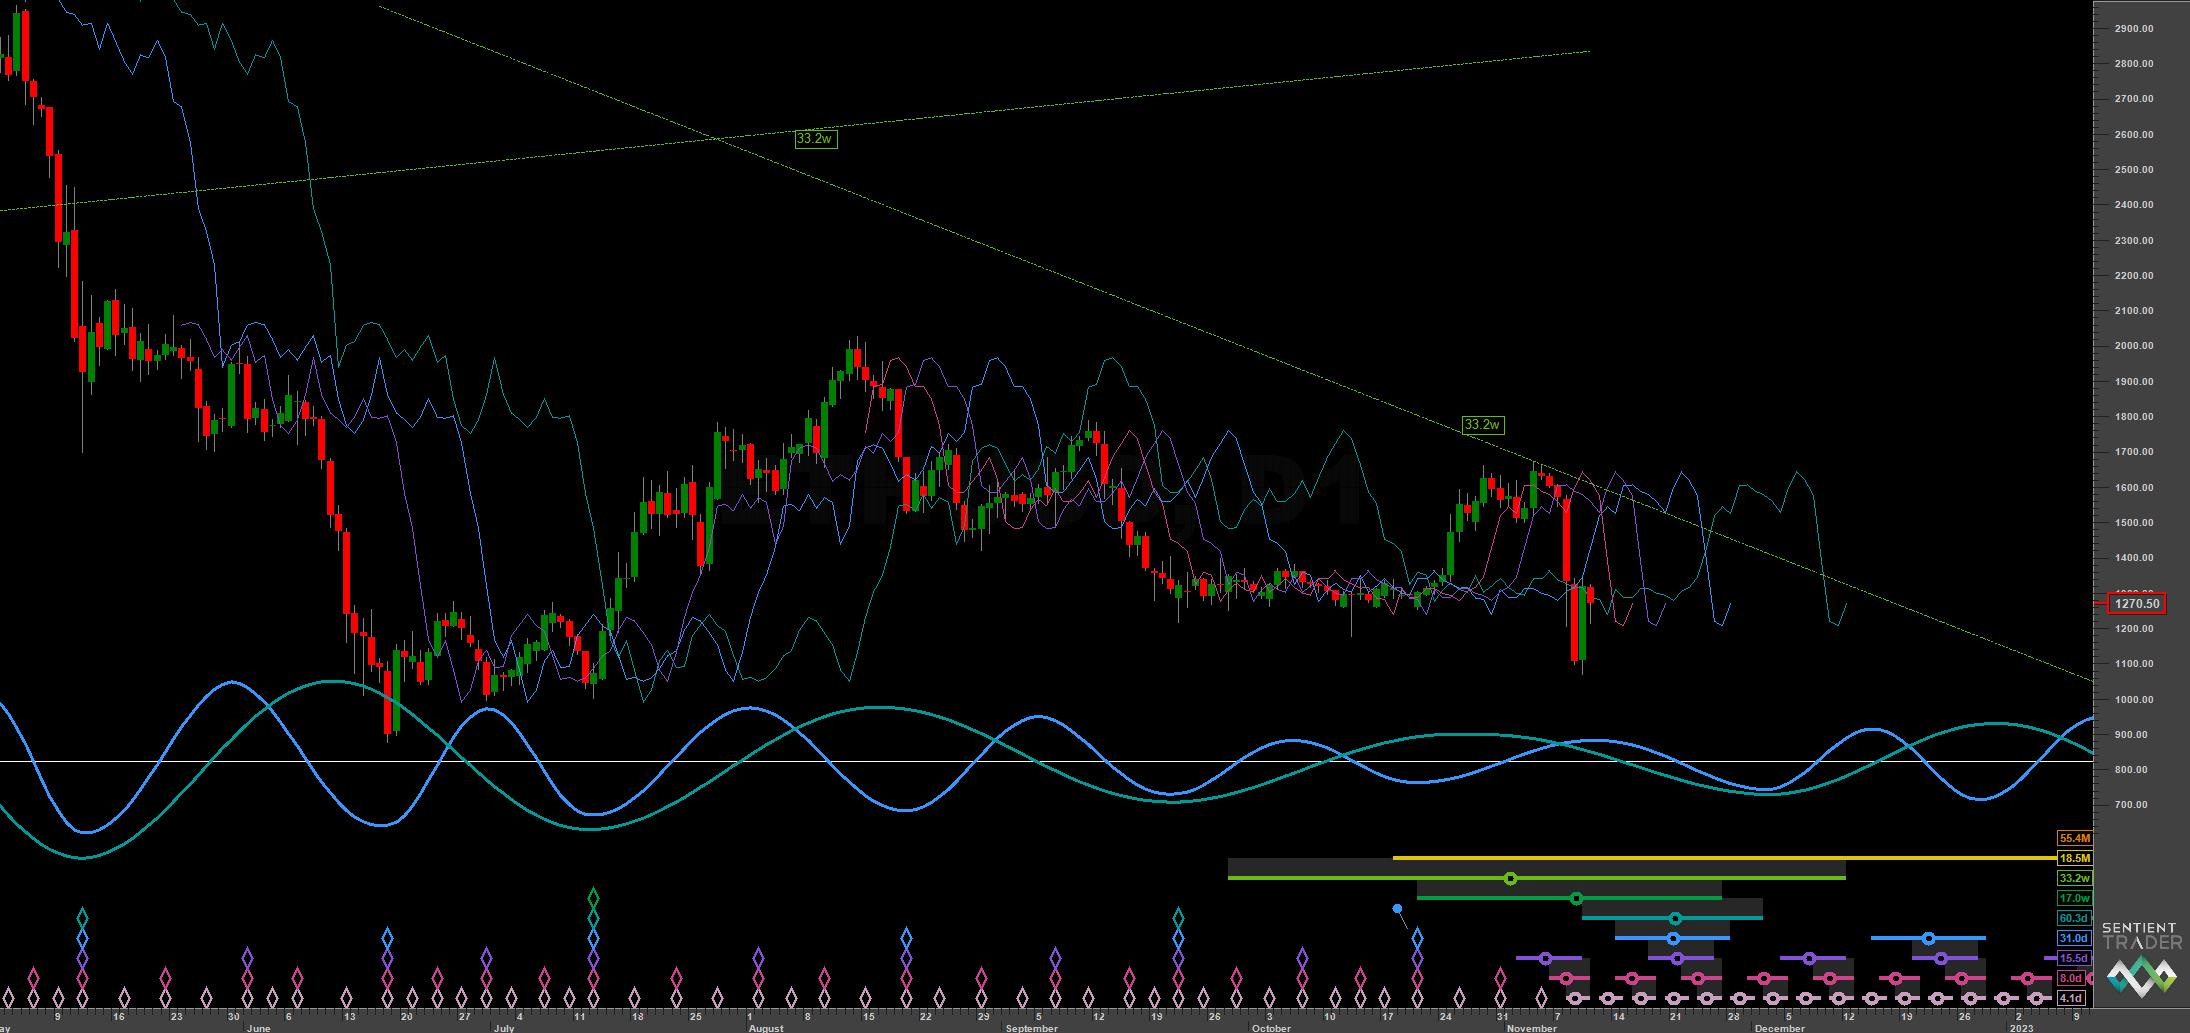
Short Term
Components around the 80 day nominal cycle
Time Frequency
Wavelet convolution output targeting 80 day nominal component

Trading Strategy
Interaction Status
Interactions and price in the FLD Trading Strategy (Advanced). This looks at an idealised 40 week cycle and an array of 3 FLD signal cycles. We apply the instrument’s phasing to the model and arrive at an overall summary for the interactions with the 20 day FLD, current and forthcoming.

Sigma-L recommendation: Strong Buy
Entry: 20 Day FLD / 40 week VTL
Stop: Below formed 80 day nominal low (also likely 18 month nominal low)
Target: Initially 2000, longer term 2500+
Reference 20 Day FLD Interaction: A
Underlying 40 Day FLD Status: A
Underlying 80 Day FLD Status: A
The phasing suggests there may well be one more 20 day component to come so caution is advised here. Price is volatile around this large low and this is generally always the case for an ‘edge band’ transaction (touching the ‘edge’ of the constant width envelope channel in Hurst terms, see PM for details).
FLDs are stacking up above price in a bearish cascade but the main confirmation of the 18 month nominal low forming will be a median weekly price cross of the 40 week downward VTL (shown in green on all charts).
Subsequent to that we can reasonably expect price to test the peaks of the last 20 week component, up around the 2000 level.
FLD Settings
If you do not have the use of Sentient Trader use these settings to plot FLDs in your trading software (daily scale) to more easily follow trading signals and strategy from Sigma-L.
Make sure to account for non-trading days if your broker omits them in the data feed (weekends, for example). The below offsets are given with no added calculation for non-trading days.
80 day nominal: 60.3 days | 30 day FLD offset
40 day nominal: 31 days | 16 day FLD offset
20 day nominal: 15.5 days | 8 day FLD offset
10 day nominal: 8 days | 4 day FLD offset