

US Dollar Index - 9th January 2024 | @ 180 Days | + 3.02%
Last trade: + 3.02% | 'B' class signal detected in US Dollar Basket / Index. Running at an average wavelength of 180 days over 14 iterations since June 2017. Currently troughing.


ΣL Cycle Summary
This excellent wave in the Dollar Index is currently the dominant driver of price action - at least over the last two iterations and certainly shows stationarity for a prolonged period in our sample of 14 iterations, since mid 2017. The most recent down leg was typified by a linear move, largely attenuating the shorter wave around 80 days in the process and almost completely retracing the up leg. The result is an almost entirely neutral cycle from the last low of this component in July 2023. The next peak is due at the end of the first quarter this year, time frequency analysis below showing the details of this and further characteristics.
Trade Update
See also: Live ΣL Portfolio & History
Summary of the most recent trade enacted with this signal and according to the time prediction detailed in the previous post for this instrument, linked below.
Type: Late Sell - US Dollar Index 8th November 2023
Entry: 8th November 2023 @ 105.590
Exit: 9th January 2024 @ 102.405
Gain: 3.02%
Current Signal Status
Defining characteristics of the component detected over the sample period.
Detected Signal Class: B - learn more
Average Wavelength: 179.83 Days
Completed Iterations: 14
Component Yield Over Sample: 52.18% - learn more
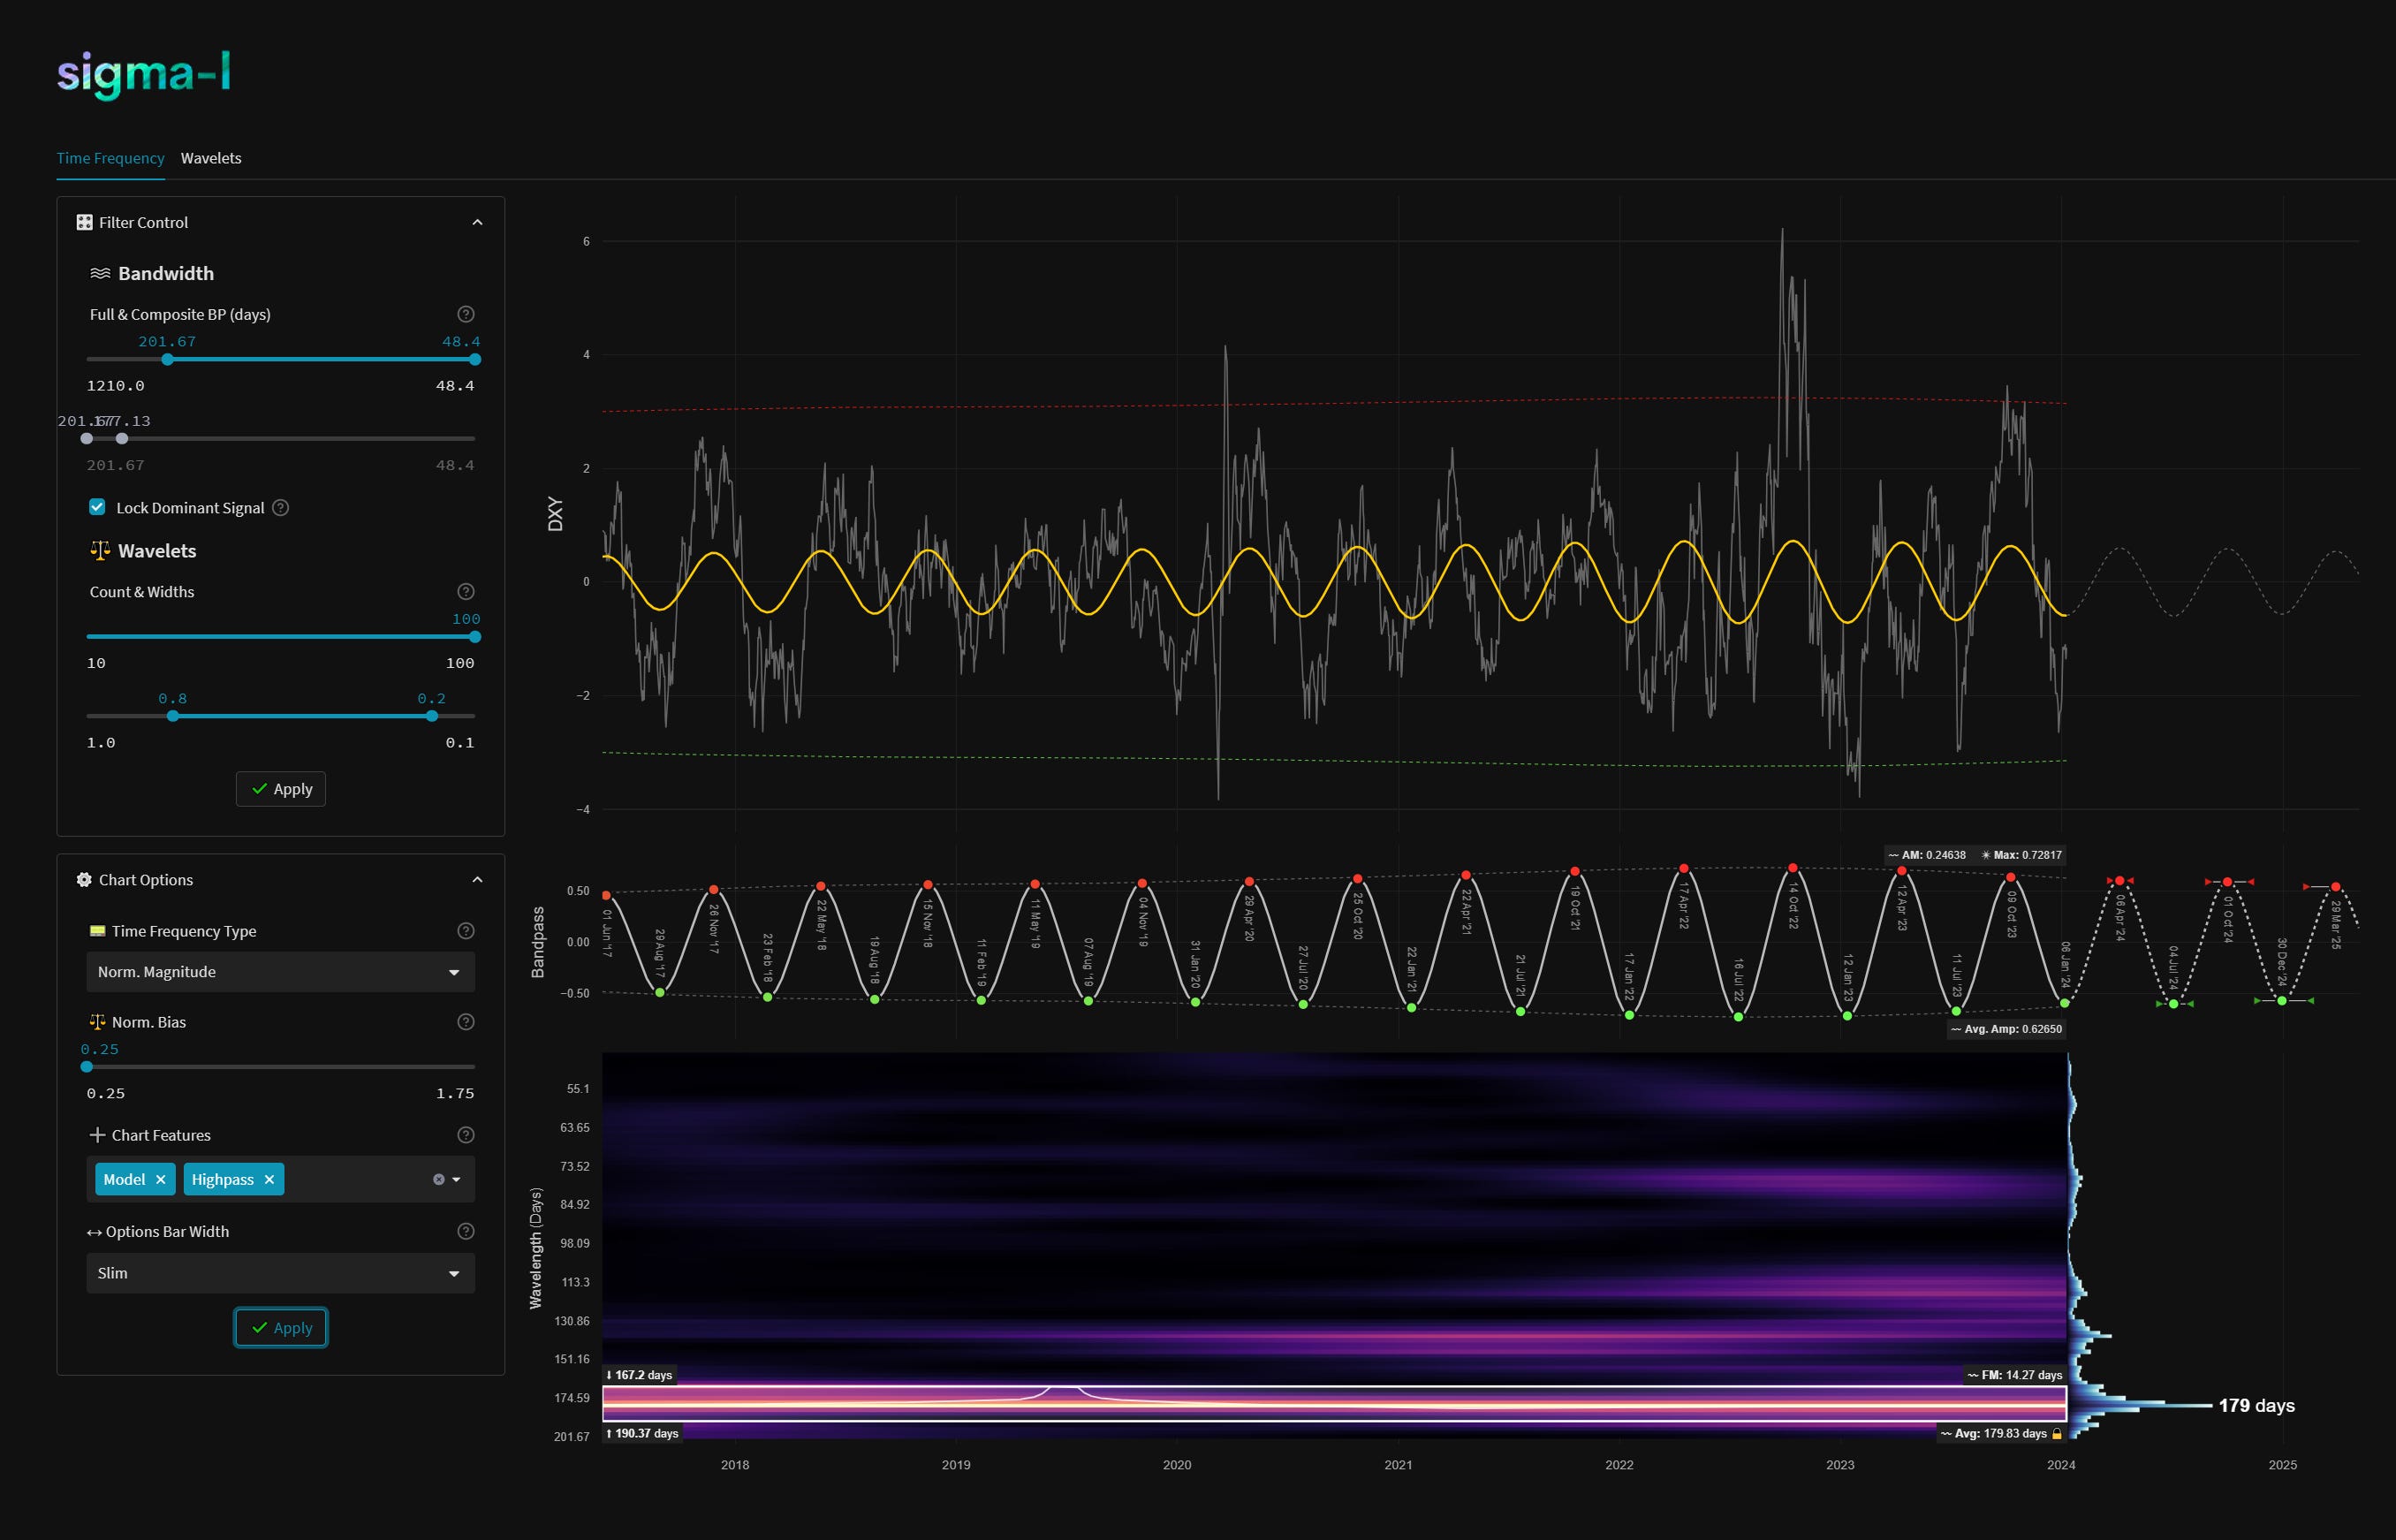
Time Frequency Analysis
Time frequency charts (learn more) below will typically show the cycle of interest against price, the bandpass output alone and the bandwidth of the component in the time frequency heatmap, framed in white. If a second chart is displayed it will usually show high-passed price with the extracted signal overlaid for visual clarity.
Current Signal Detail & Targets
Here we give more detail on the signal relative to speculative price, given the detected attributes of the component. In most cases the time target to hold a trade for is more important, given we focus on cycles in financial markets. Forthcoming trough and peak ranges are based upon the frequency modulation in the sample (learn more).

Phase: Troughing / Troughed
FM: +- 14 Days
AM: 0.24638
Next Trough Range: 20th June - 18th July, 2024
Next Peak Range: 23rd March - 20th April, 2024
Sigma-L Recommendation: Buy
Time Target: ~ 6th April, 2024
Current Signal Phase
This is ‘how far along’ the cycle is in it’s period at now time and is related to the predicted price action direction.
Current Signal Frequency Modulation (FM)
This is how much, on average, the signal detected varies in frequency (or wavelength) over the whole sample. A lower variance is better and implies better profitability for the component. Frequency usually modulates relatively slowly and over several iterations.
Current Signal Amplitude Modulation (AM)
This is how much the component gains or loses power (price influence) across the sample, on average. Amplitude modulation can happen quite quickly and certainly is more evident than frequency modulation in financial markets. The more stable the modulation the better.