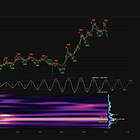
Copper (XG/USD) - 16th June 2025 | @ 152 Days | + 6.67%
Last trade: + 6.67% | 'B' class signal detected in Copper (XG/USD). Average wavelength of 152 days over 9 iterations since September 2021. Currently moving up
ΣL Cycle Summary
Macro news characterised this particular down-leg in the cycle highlighted here, a tremendous periodic feature across copper and related derivatives. The ‘tariff’ spike came after the peak of the cycle and is detected as a transitory higher frequency feature in the time-frequency results, below. The larger component, described in this report, continues to beat away with stationary power and is running at around 150-160 days average wavelength. The price and cycle trough has likely passed a few weeks ago so this will be a late buy as the phase is hard up at the time of writing. Regardless, there is a significant portion of time until the next peak, due early-mid August this year. Keen and long term readers will note the almost complete attenuation of the previously excellent cycle around 80 days as the larger component dominates price action. For a sample of that feature check out a report from 2 years ago as a matter of interest!
Trade Update
Summary of the most recent trade enacted with this signal and according to the time prediction detailed in the previous report for this instrument, linked below.
Type: Sell - Copper 26th March 2025
Entry: 26th March 2025 @ 5.221
Exit: 16th June 2025 @ 4.873
Gain: + 6.67%


