

Anatomy of a Trade: USDCAD
In this first edition we look at a long trade around the 20 week low in October 2021.

The Setup
Twitter is very useful for traders because we can go back and examine the performance of an analysis over time, which lends itself to this kind of helpful insight for readers of Sigma-L. In this first edition of a series where we look at entering, managing and exiting trades using Hurst Cycles, USDCAD will be our initial candidate.
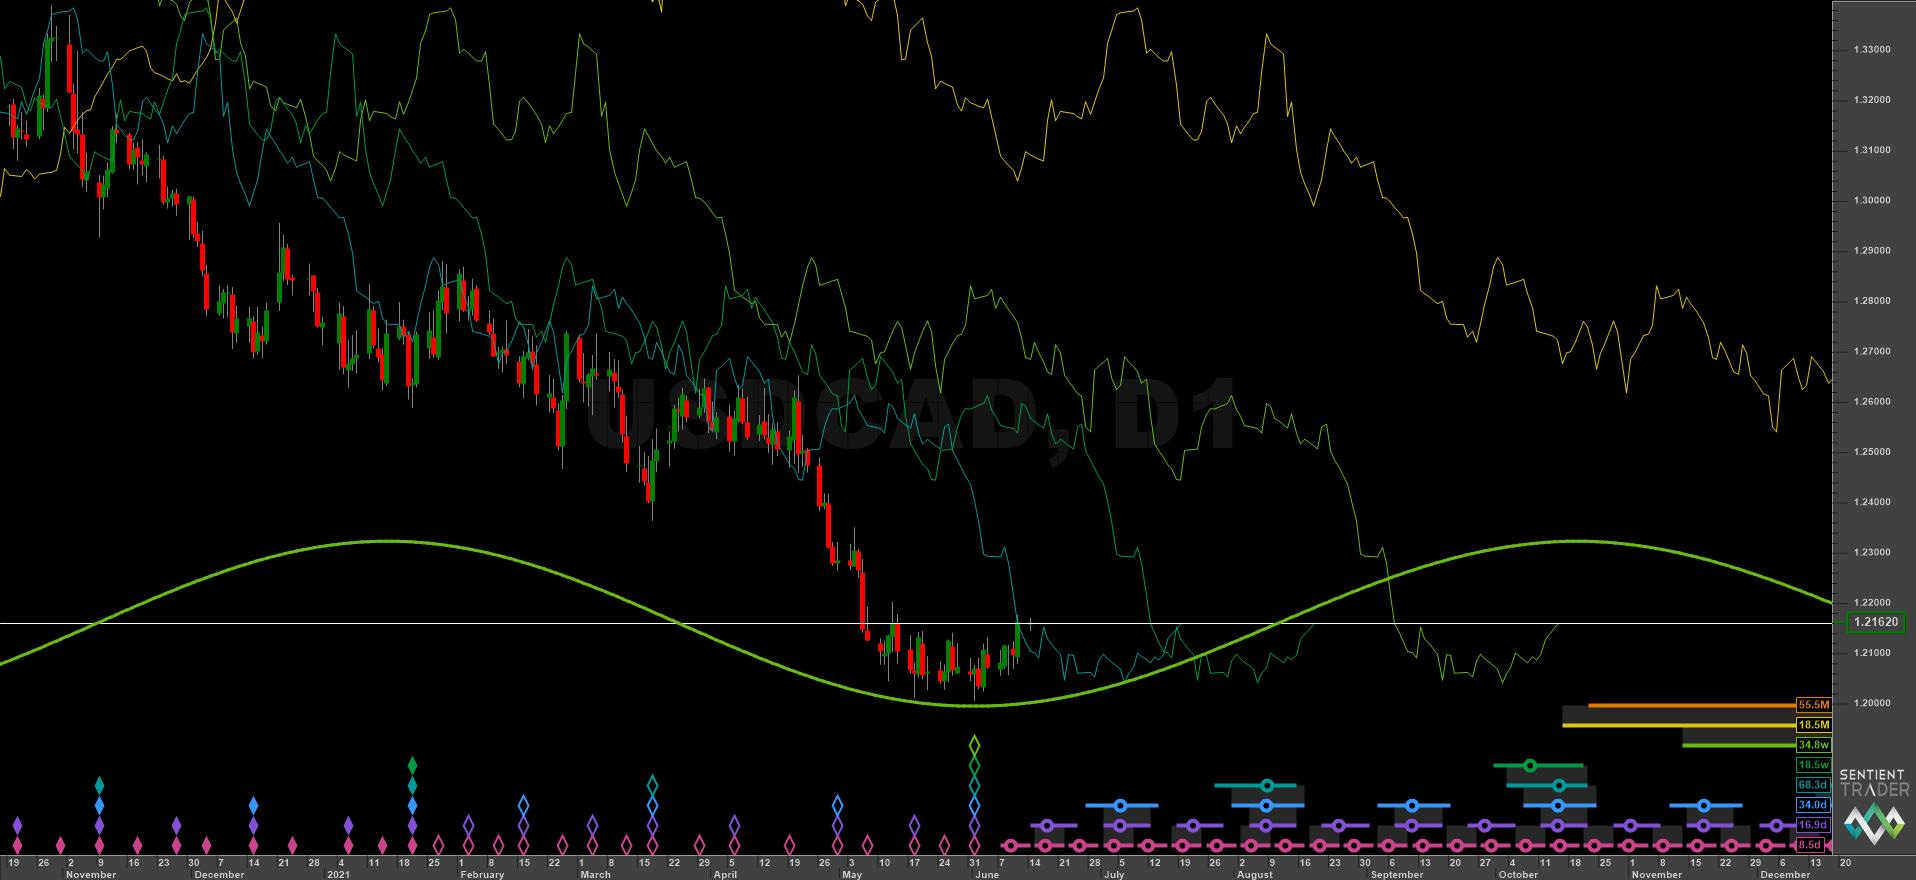
Price had moved from a low of at least 40 week magnitude in June 2021, which itself was a great swing trade targeting the 18 month FLD resistance (prior to the start of the Sigma-L site!). In mid September price began the move down to a 20 week nominal low, expected mid October and driven by resistance at the 18 month FLD (yellow).
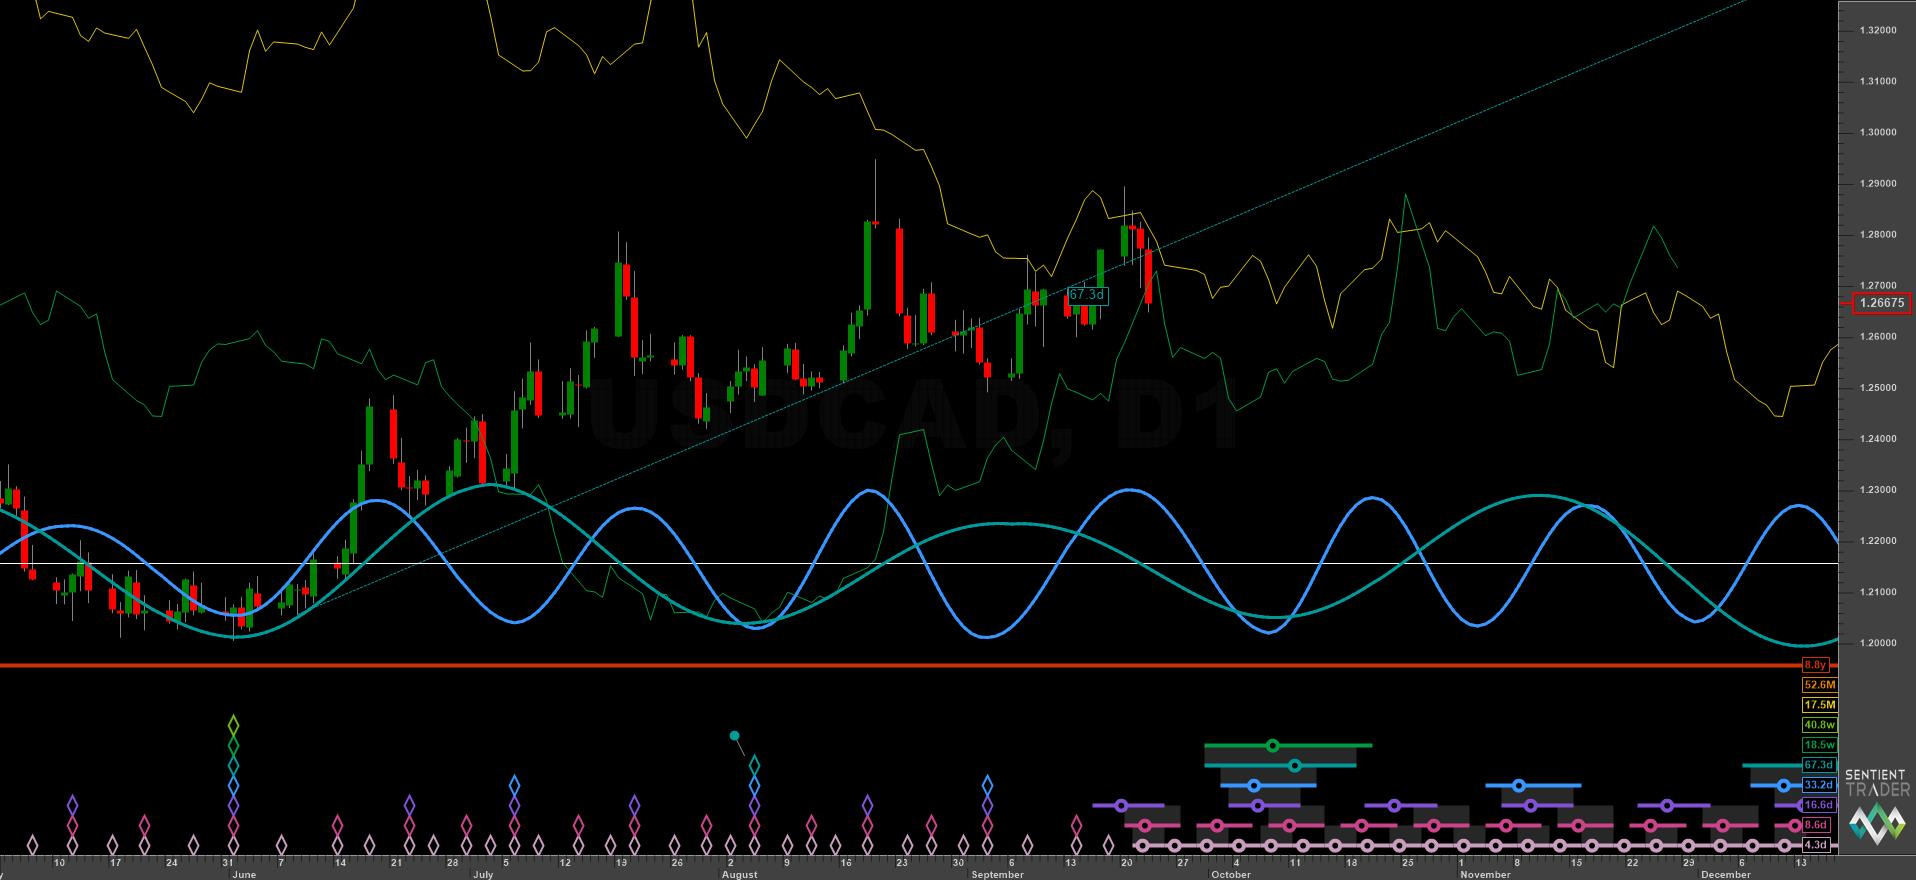
The setup was ready in mid-late October with a cascade of FLDs forming a bullish setup and a choice of entry points. At this stage a cross of the 10 day FLD would confirm the 80 day nominal low and by the principle of synchronicity the 20 week nominal low too. It was important to be patient at this point, entering only on valid cyclical signals. For entries we will usually place a stop order at the level of the chosen entry FLD so it will automatically trigger when price reaches that level. Each day we adjust the stop level if it has not been triggered to reflect the new FLD value.
The 20 week FLD and 18 month FLD was at a clear resistance level above price around 1.28 and was chosen as the trade target. As price moves through the bullish FLD cascade FLD cross targets are noted and extrapolated.
Entry Criteria and Targets
Entry: 10 Day VTL / 10 Day FLD / 20 Day FLD
Target: 20 Week FLD / 18 Month FLD resistance around 1.28
Stop: Below confirmed 20 week nominal low
Trade
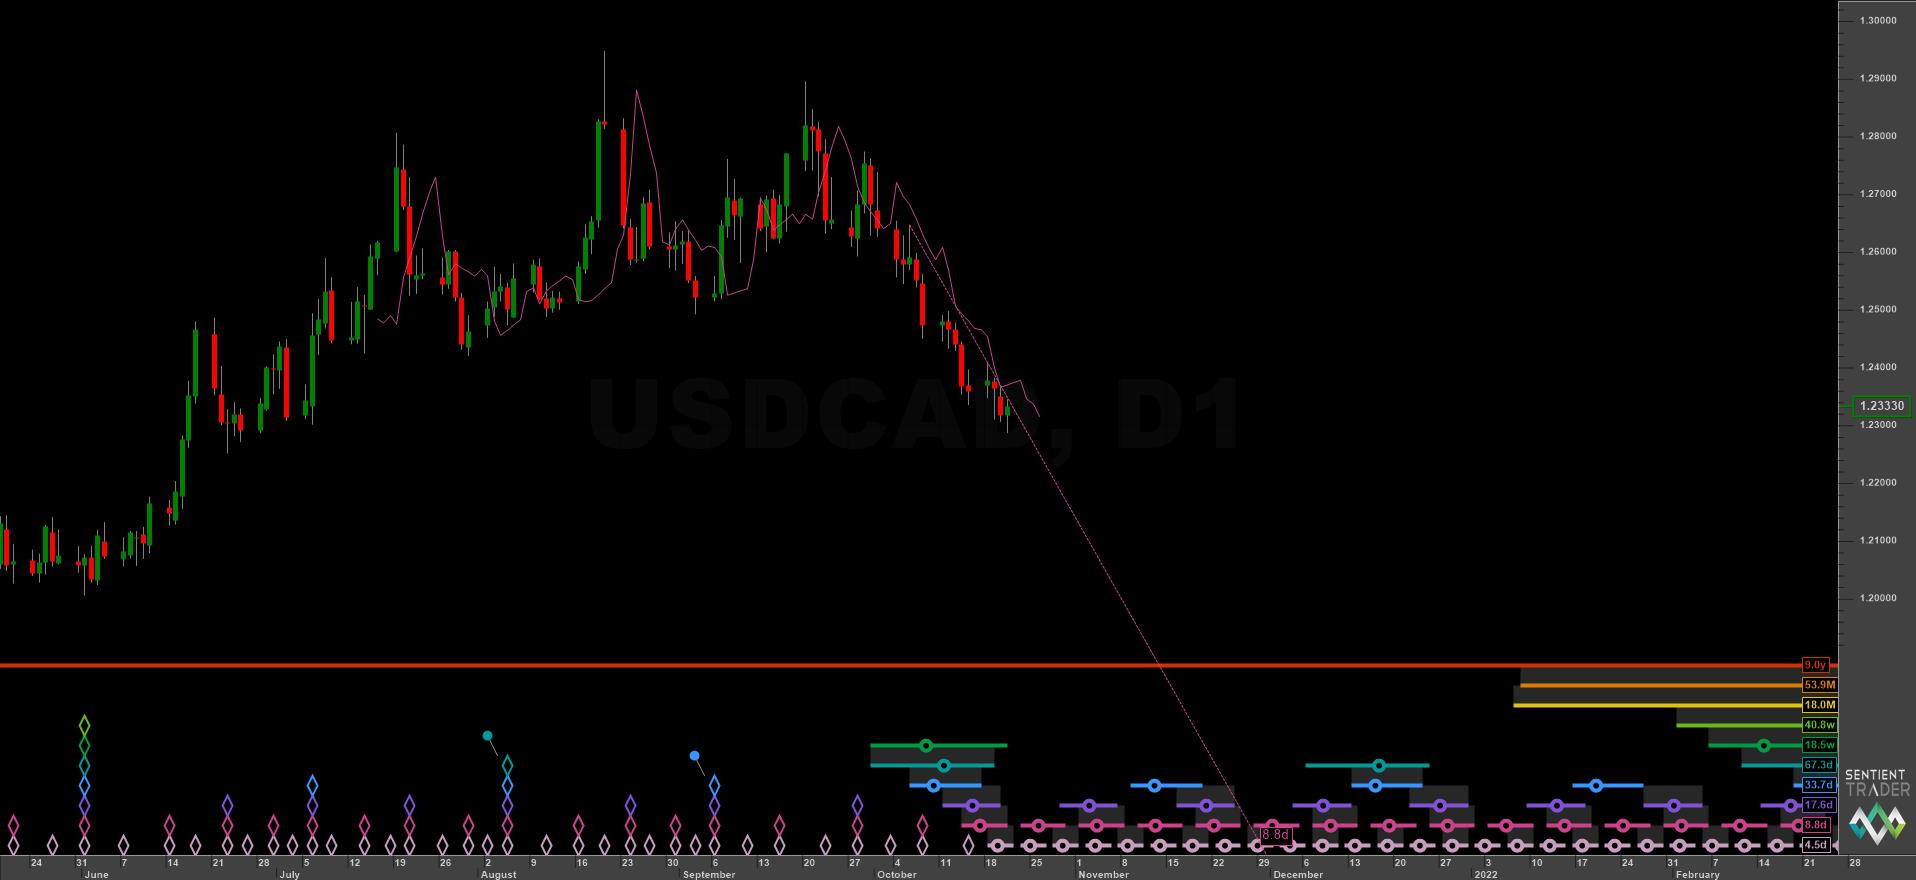
October 15th
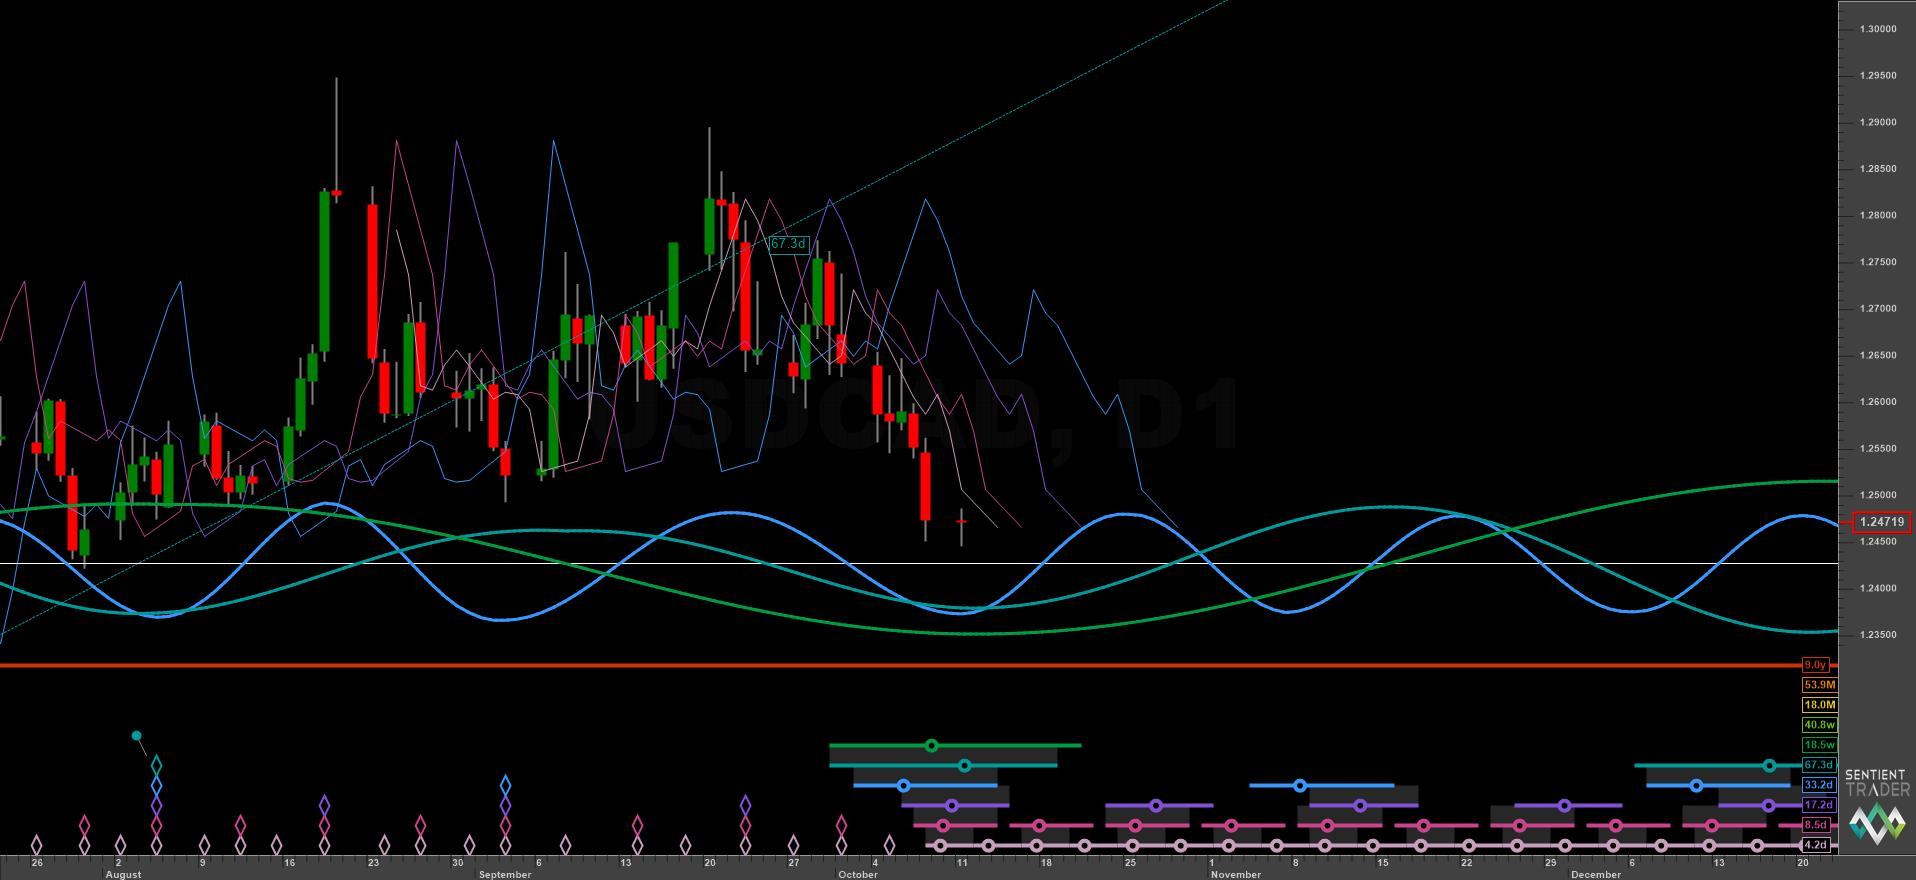
Price continued to move down and the placement of the 20 day component was clarified as occurring on the 28th of September. This assisted us further as we could measure the number of days elapsed since that low and compare it to the sample average of 17.6 days. The 20 week low was imminent but we still await our correct entry point. We now also add the 10 day downward VTL (pink) as a valid entry point and have a choice between that and the 10 day FLD, both being good entries. We note that price also has found resistance at the 5 day FLD (white). This is noted as a very risk on entry but still valid.
October 21st
Price is now extremely close to the 20 week low with the nest of lows suggesting it is overdue - but we still do not have a point of entry. This is now shaping up to be a wonderful low risk / high reward trade as the 10 day downward VTL forms obvious resistance to price. A daily median price break of that VTL is our entry point.
Subsequent to the below image being posted on the day, median price broke the VTL and we entered our trade.
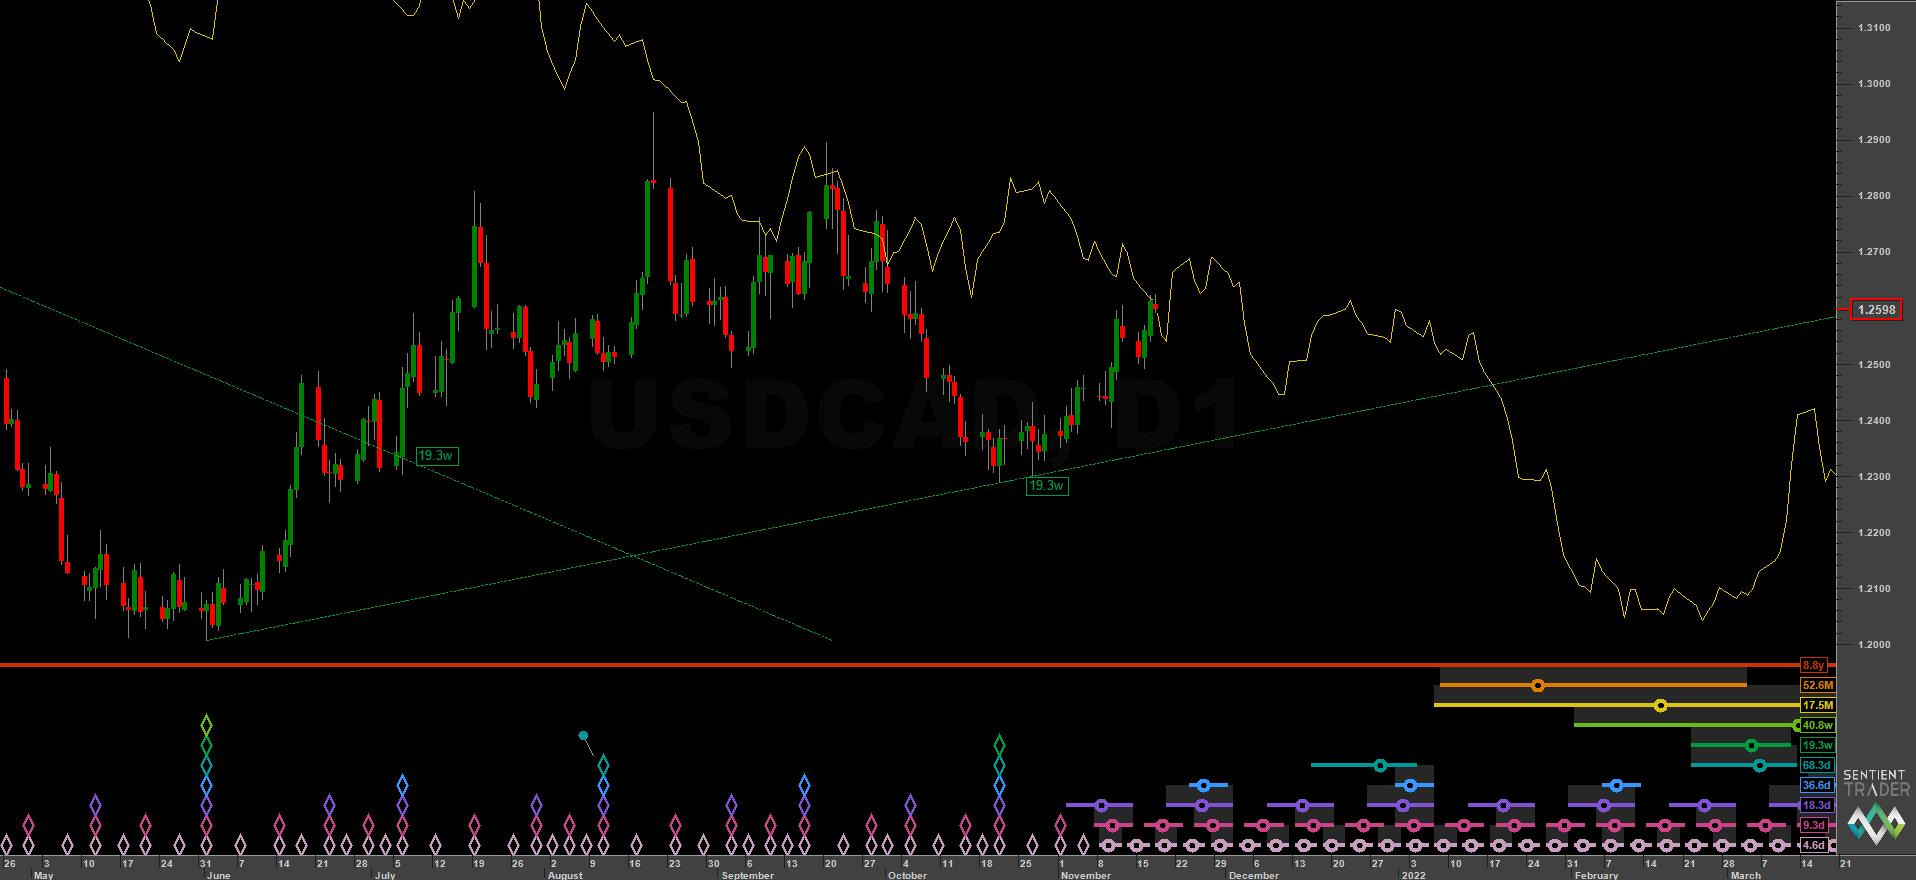
November 18th
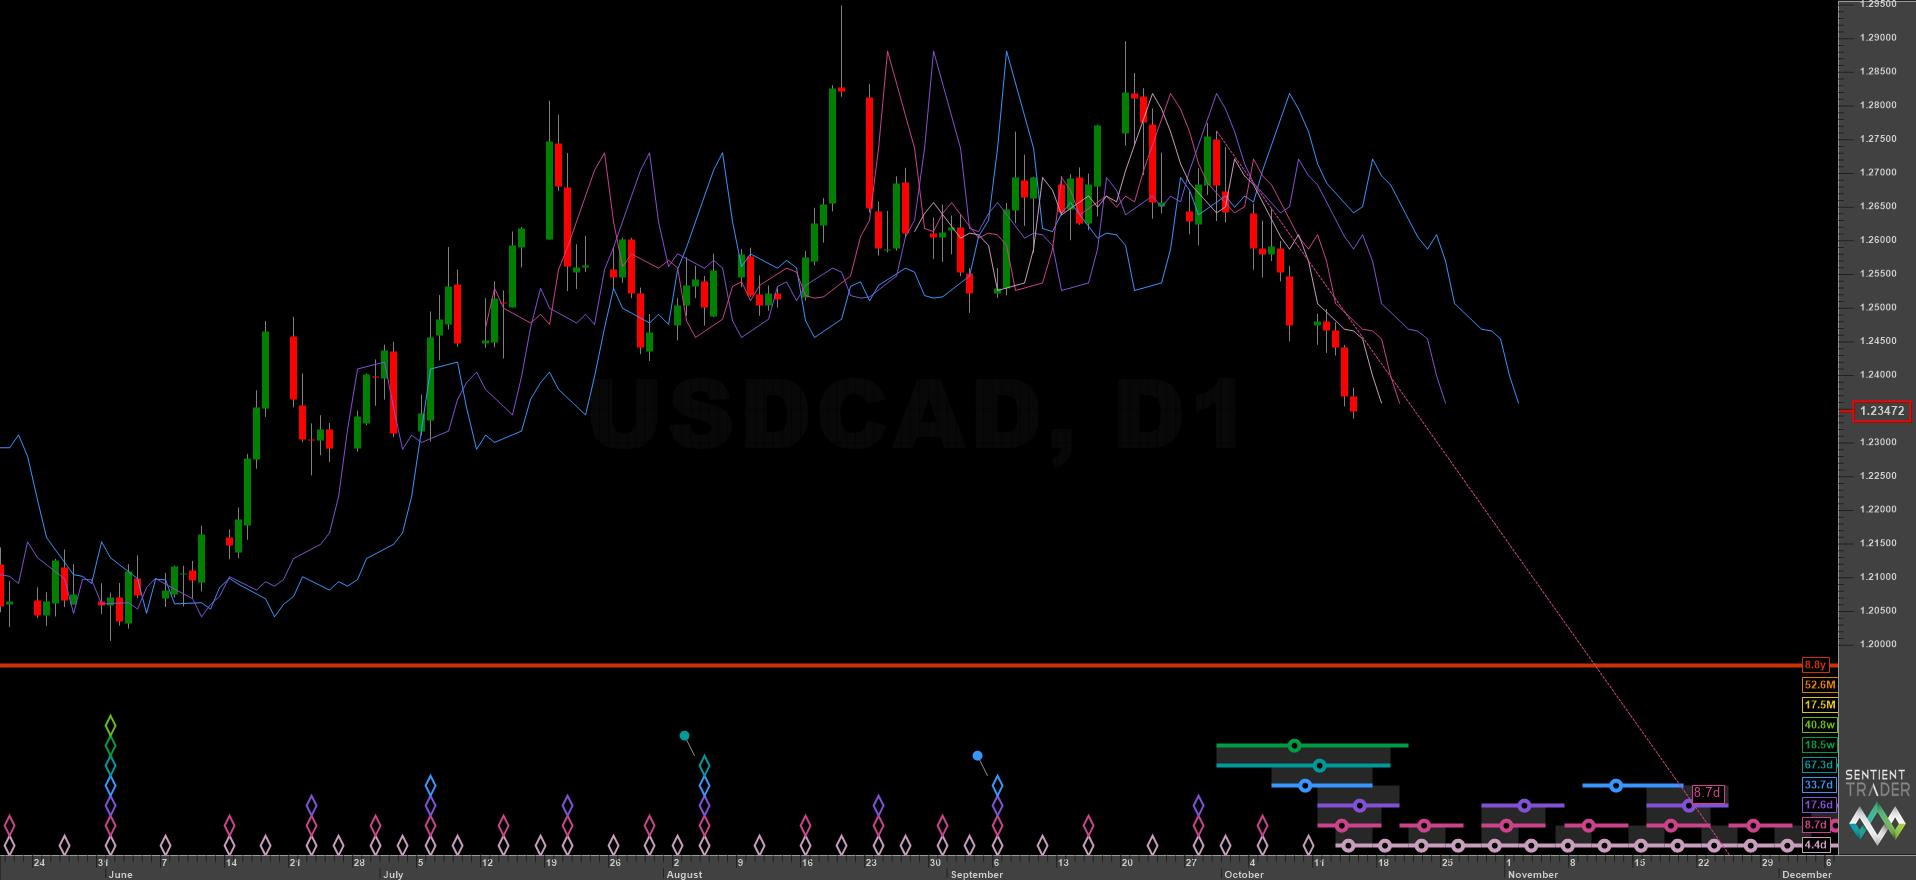
Due to the low being a 20 week nominal trough we knew price should reach up to the 18 month FLD easily within the first 80 day component. We noted the position of FLD crosses and found in the rise price exceeded both the 20 day FLD cross target and the 40 day FLD cross. It also crossed past the 80 day FLD and projected a target to 1.278. This point was chosen as our exit area, being close to the 20 week FLD resistance around 1.28.
We also noted that should price meet and exceed the 80 day target then we should possibly assess whether the 40 week low in June was also infact of 18 month magnitude. A median price cross of the 18 month FLD itself would also add further evidence.
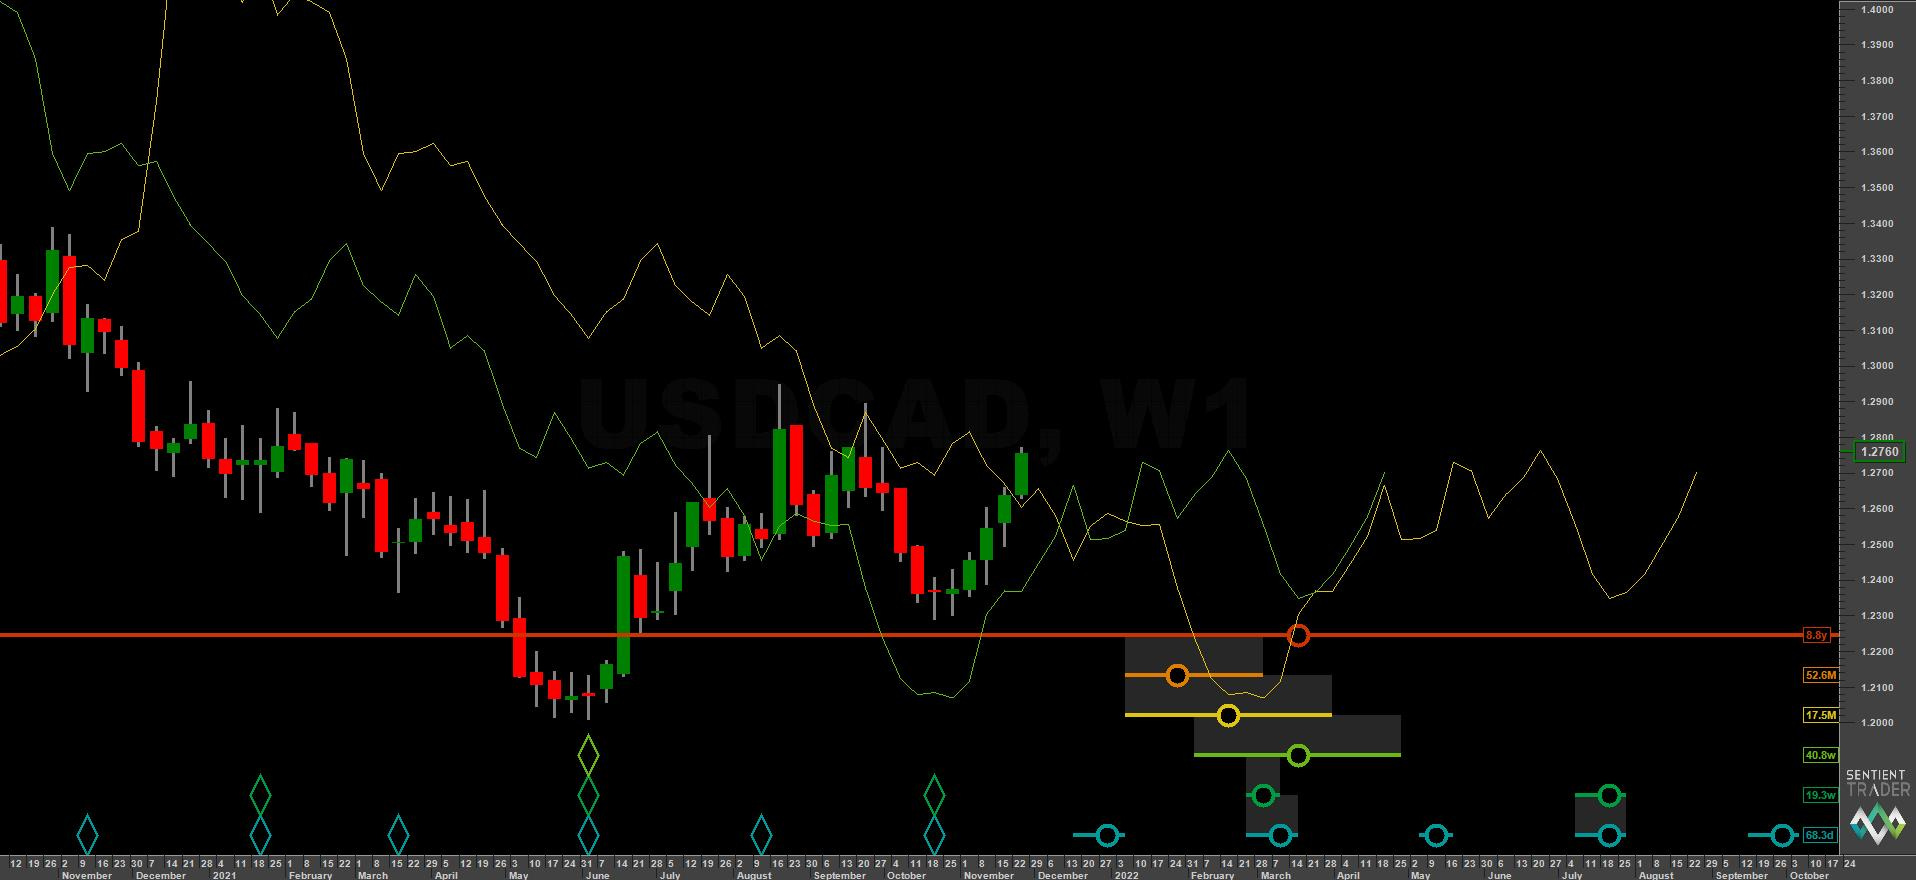
November 26th
With the 20 week low confirmed and price marching upward toward our 80 day FLD cross target we could have a look at the weekly view. We noted that price had crossed the 18 month FLD, providing evidence that the low in June 2021 may have been the 18 month / 9 year nominal low. This is vital information going forward and in anticipation of the 40 week nominal low due in march 2022.
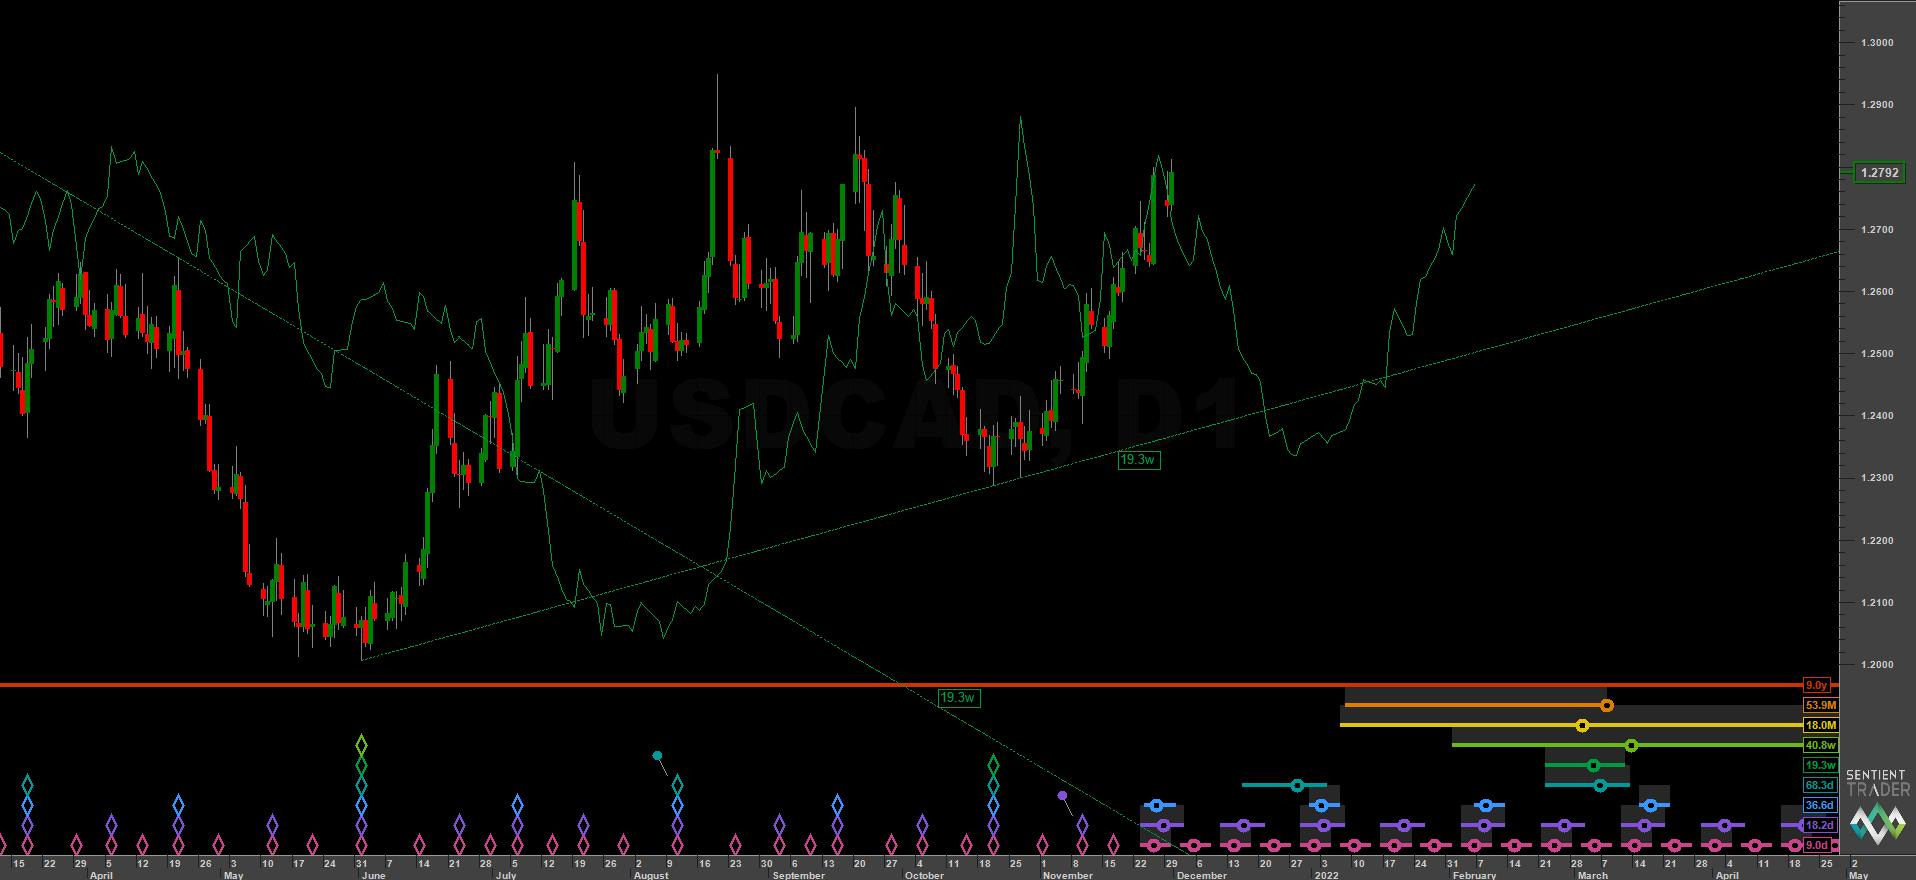
November 30th
Price reached our target of 1.278 and the general area of resistance around the 20 week FLD at 1.28, previously mentioned at the start of the trade. Another option for a cyclic exit may have been the 40 day upward VTL, a cross of which confirms the peak of the 80 day component. As Sentient Trader had not yet assigned the 40 day low it is not drawn on the charts here but it would have been a valid exit point, were it not for our main 80 day FLD cross target to be reached already.
Summary
This was a good ‘swing’ style trade with an excellent risk:reward ratio. The entry point required patience and a trust in the technique to overcome psychological barriers. The principle of synchronicity was important here and defined our ability to enter at a cycle entry degree much lower (10 day) than the cycle target degree signal (20 week). We selected valid cyclical entry points and chose that which optimised our risk:reward ratio (10 day VTL/FLD).
An estimation of the underlying trend (sigma-l) was also required to anticipate what kind of a move we might expect.