

Anatomy of a Trade: S&P 500
An analysis of the excellent short trade into the 40 week nominal low of January 2022
The Setup
Stockmarkets around the globe had been on a tremendous bull run following the 9 year nominal low in 2020. Phasing had been somewhat challenging due to the attenuation of the lower degree cycles until summer 2021 when, due to the waning bullish underlying trend, visual clarity of the 20 week and 80 day components became more apparent. This setup the ability to anticipate the move into the 20 week low (at least) expected at the end of this month and is phased here as the 40 week nominal low in the S&P 500.

Commonality was also used, taking careful note of phasings present in other indices around the globe, including the DAX, Russell 2000 (above), FTSE, Nasdaq and DJIA. They all pointed to a low of at least 80 day magnitude occurring toward the end of January 2022. The majority also indicated the low would be at least a 20 week nominal low.
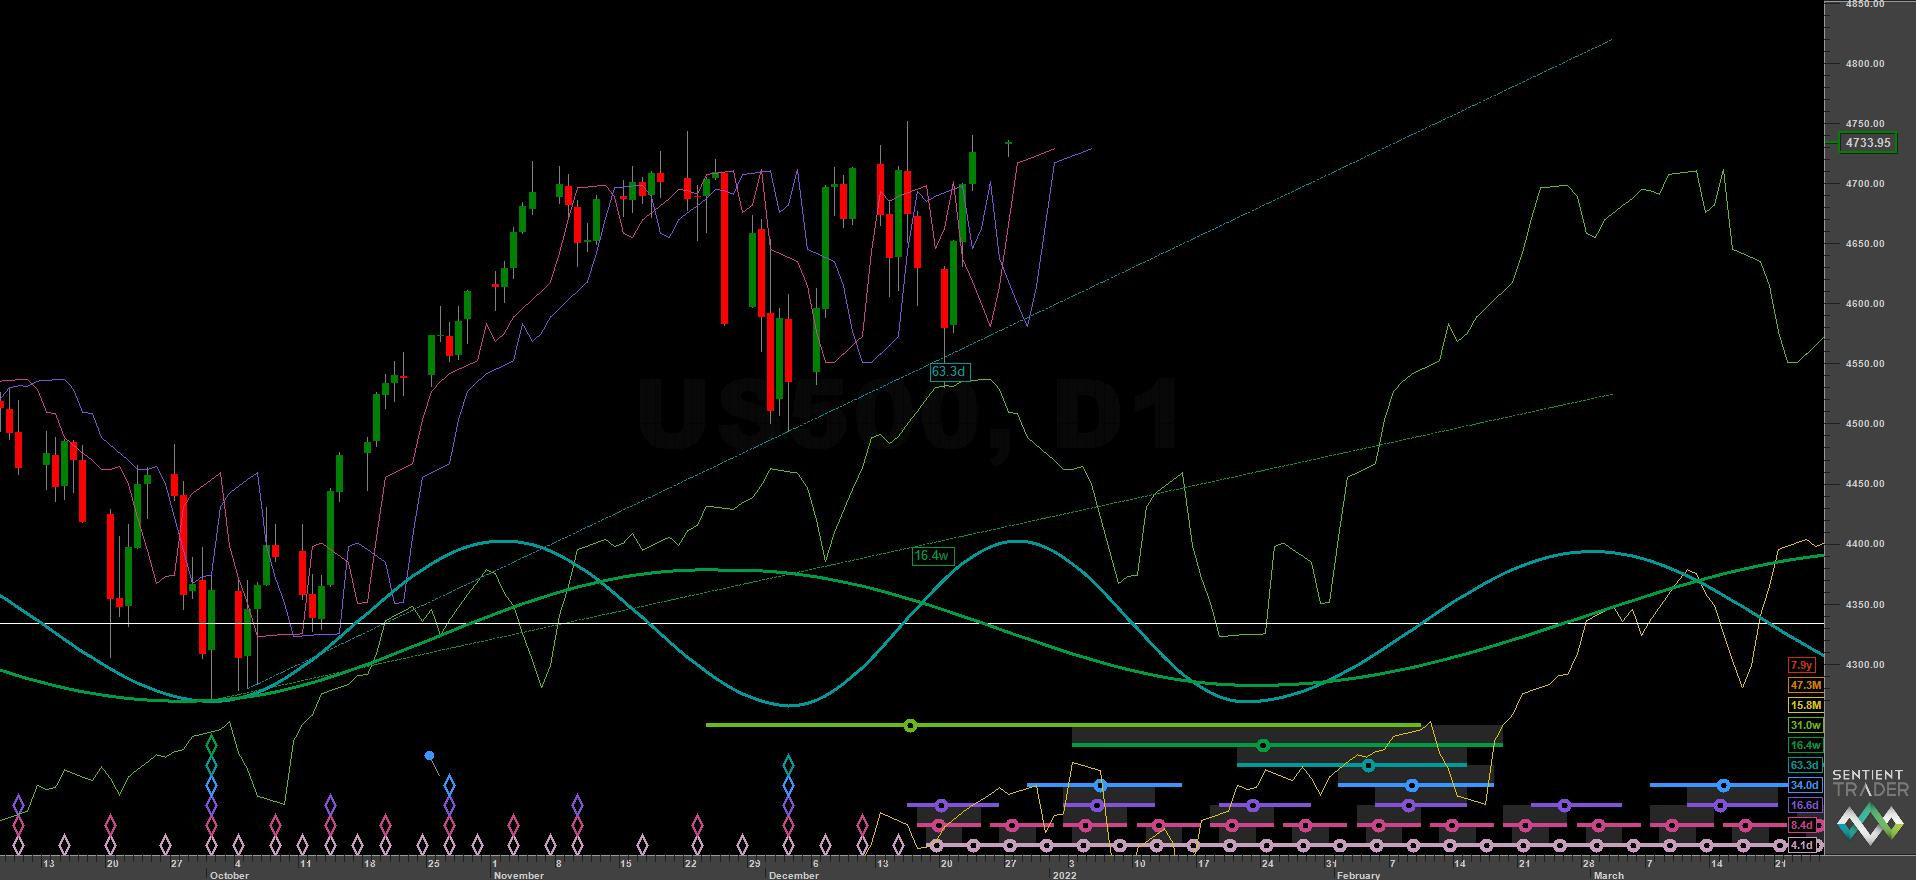
In our report of the 27th Dec 2021 we noted the unusual bearish nature of the first 20 day cycle and the interaction with the 20 day FLD. Normally, in a market with an entirely neutral underlying trend price will generally track and find support at the 20 day FLD for the first 20 day nominal low, following a trough of 80 day magnitude. In this case (and in markets across the globe) the 20 day FLD was heavily breached. This was not a signal for entry, yet, but served as a warning to ‘sit up and take notice’. Given the waning bullish underlying trend and the 40 week component heavily pushing down on price, a move to the 40 day nominal low, due at the start of January, would likely be an optimum entry into a longer term short position. The peak formed subsequent to this move would likely be the 80 day, 20 week and 40 week component crest and therefore unlikely to be breached again until after the 40 week nominal low had occurred, at the earliest.
We noted that price had been bouncing off the 40 week FLD for weeks and, if the move down was to occur as predicted, a good price target would be back at the 40 week FLD support around 4350-4400. The 20 week upward FLD was also a target, a cross of this would also confirm a peak of 40 week magnitude had indeed occurred.
The average wavelength of the 80 day and 20 week components were noted and a timeframe for the target being met calculated for the end of January to the first week of February 2022. This is also reflected in the ‘nest of lows’ shown above in the Sentient Trader software. A standard entry of a 20 day FLD cross would be used but other viable entry points were the 10 day FLD (pink) and 10 day VTL, both providing slightly higher risk:reward ratios but with added cyclical risk.
Entry Criteria and Targets
Entry: 20 Day FLD
Target: 4550 - 4350 (80 day VTL and 40 week FLD respectively)
Stop: 4817.50 (Above confirmed 40 day nominal peak)
Trade
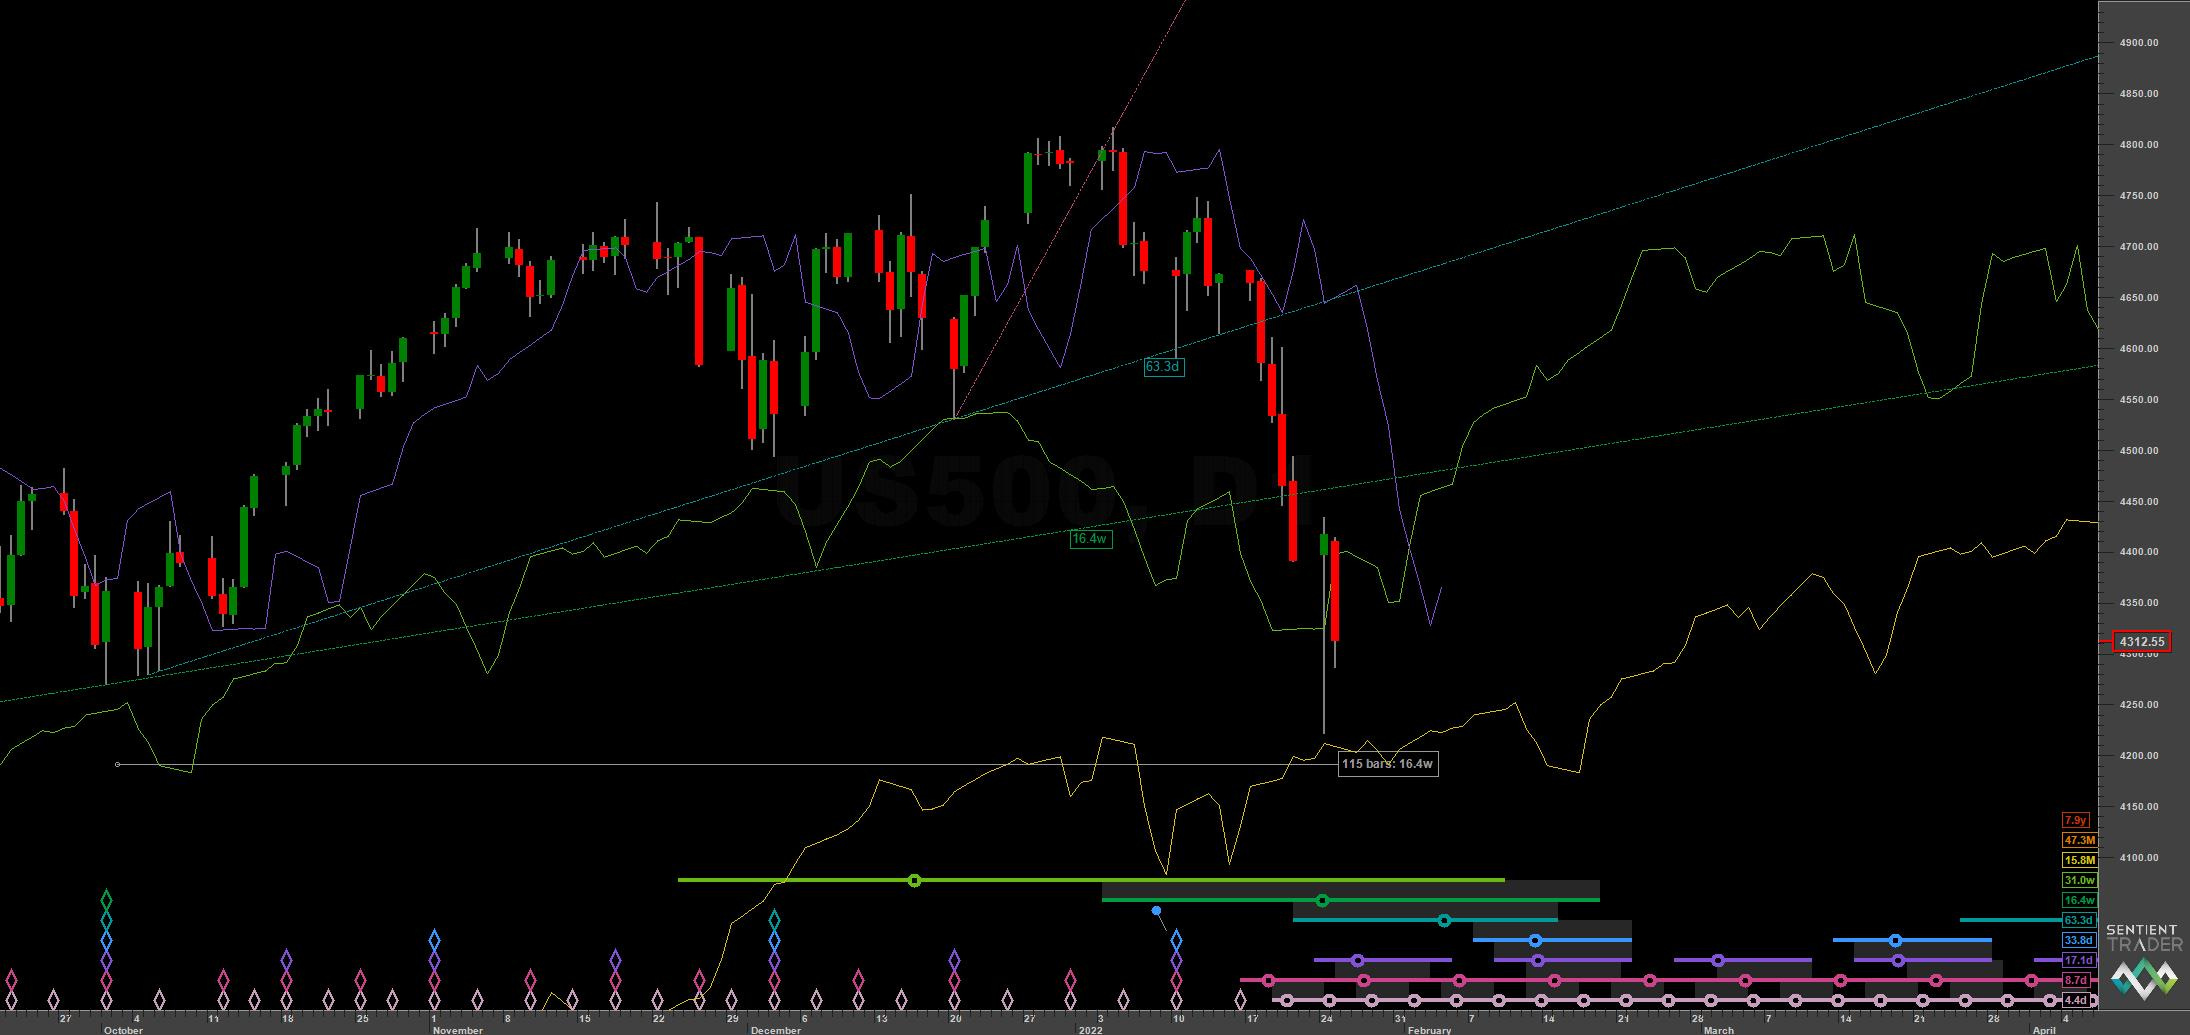
The short entry came on the 5th of January at 4747.65, the level of the 20 day FLD at the point price crossed it. We were initially looking for the 40 day nominal low to occur a week or so after and expected price to bounce back up for the ‘E’ category interaction with the 20 day FLD.
The bounce came, weakly, from around the 80 day VTL, price moving back up to the 20 day FLD and reversing at it, a very good sign for more bearish price action to come. This is because in an entirely neutral underlying trend the move from the 40 day nominal low would usually be expected to breach the 20 day FLD quite easily.


At all times we noted commonality with other global indices for any part of the phasing that provided uncertainties. A phasing analysis is a huge, fascinating jigsaw puzzle with many complicated parts and some entirely random variation. An essential tool to increase the signal to noise ratio for any Hurst analyst is that of commonality!

The move from the 40 day nominal low (made on the 10th January) came and went very briefly, the low breached in this case prior to the first 10 day component occurring, as shown above. This was a very bearish sign. Our first target of 4550 had been achieved, there was high probablity, given the amount of time remaining in the 80 day component, more bearish movement was to come.

Of course bearish movement did indeed come, with price collapsing in spectacular fashion across the world markets, the S&P 500 actually being one of the more mild corrections. The 80 day and 20 week FLD cross targets were met aswell as the 20 week upward VTL cross, shown above. The latter confirming a peak of at least 40 week magnitude had occurred, likely at the end of 2021.
Our lower target of 4350 was achieved yesterday and price currently sits around the 40 week FLD. The 40 week low is due shortly and we have the 18 month FLD below price too. The phasing suggests the low here is of only 20 day magnitude but we will watch this for signs in the coming couple of weeks.
Summary
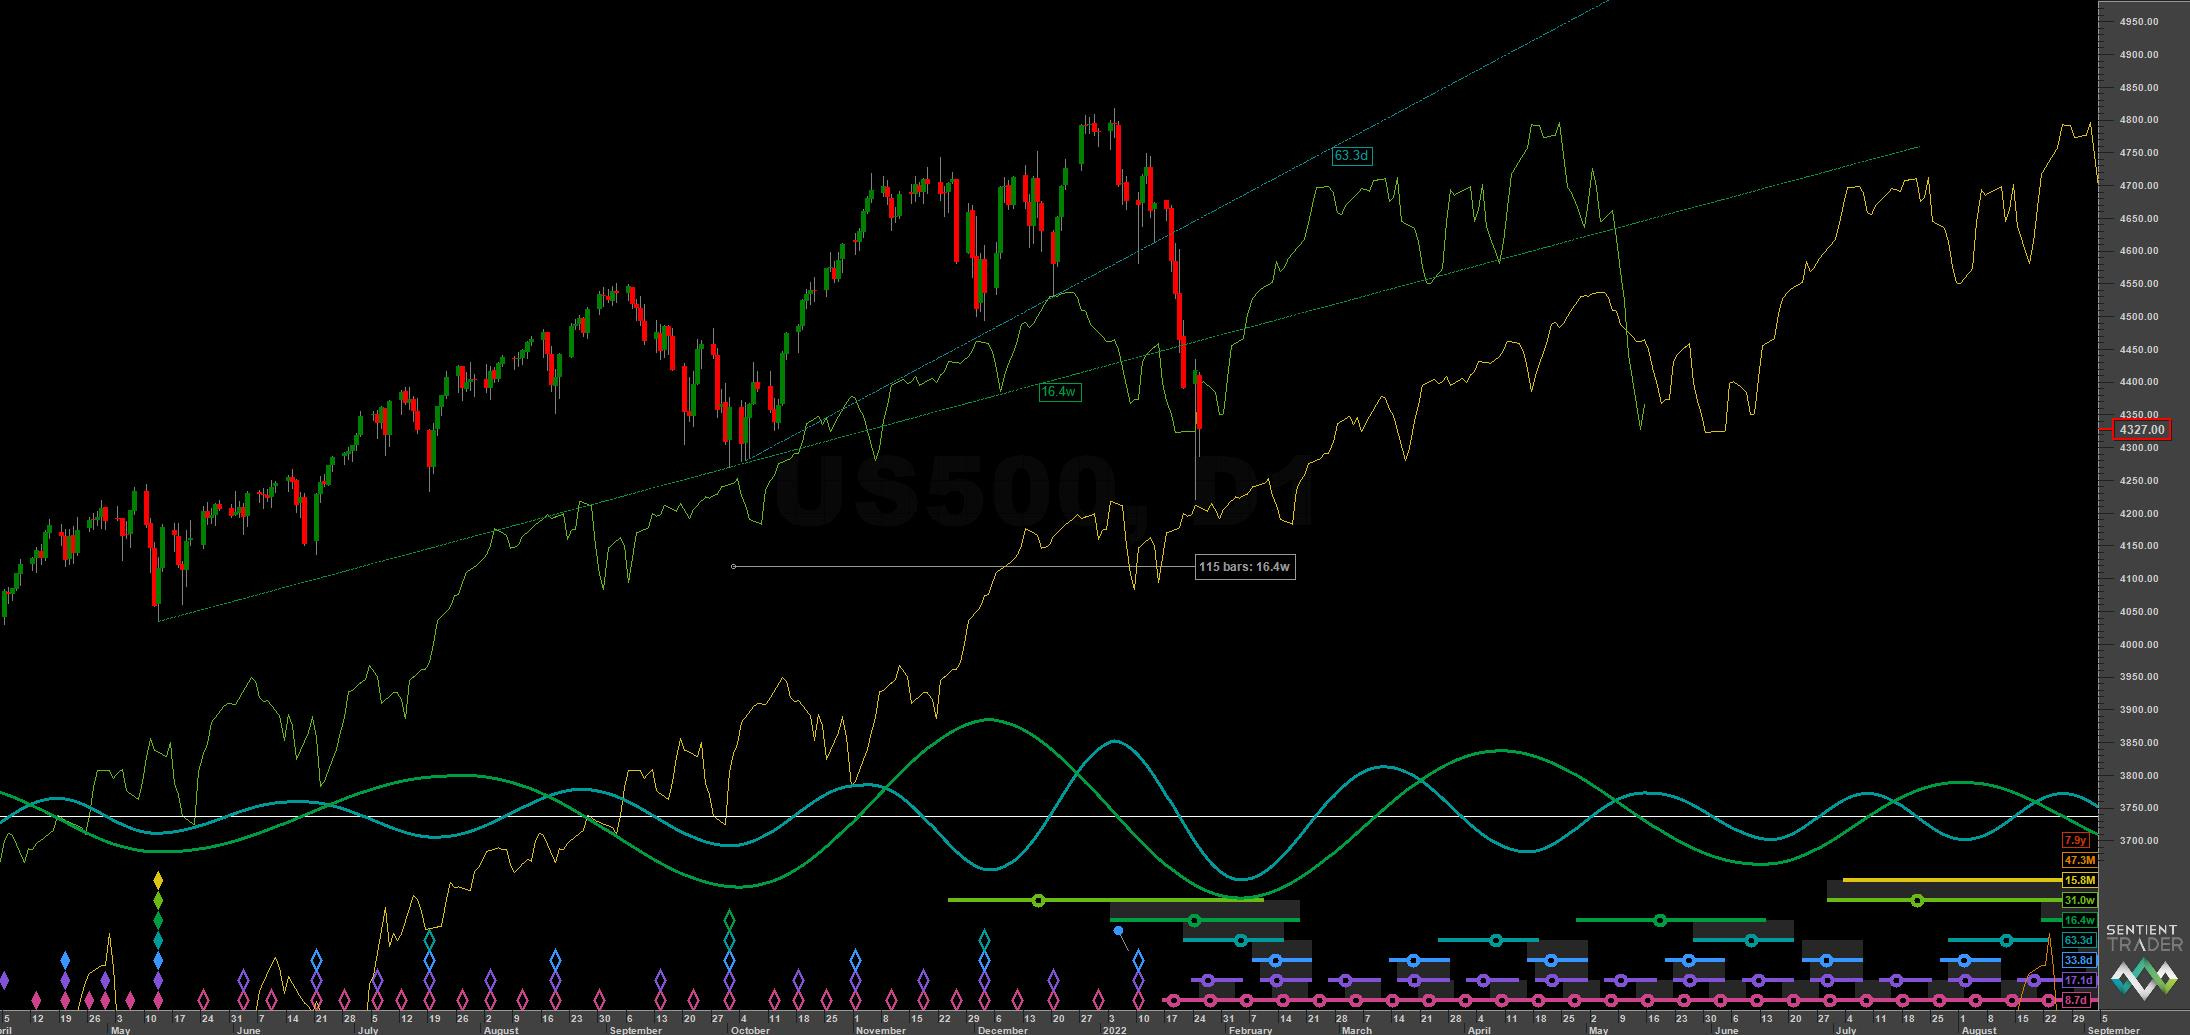
This short trade was a standard bearish entry at the end of a 40 week component. It suprised to the downside because the relatively recent 9 year component in 2020 would, all things being equal, be still supporting the underlying trend somewhat. The fact price has moved down with such vigour is interesting and sets up a fascinating journey in 2022. The first leg of which will be the response upward move from the 40 week component here. If the general price action is sideways, expect the move to the next 20 week low, due in the summer, to be the start of more bearish fireworks.
Join us today and enjoy the robust, insightful market knowledge Hurst Cycles can bring.