ΣL US Stock Market Composite - 16th July 2024 | @ 81 Days
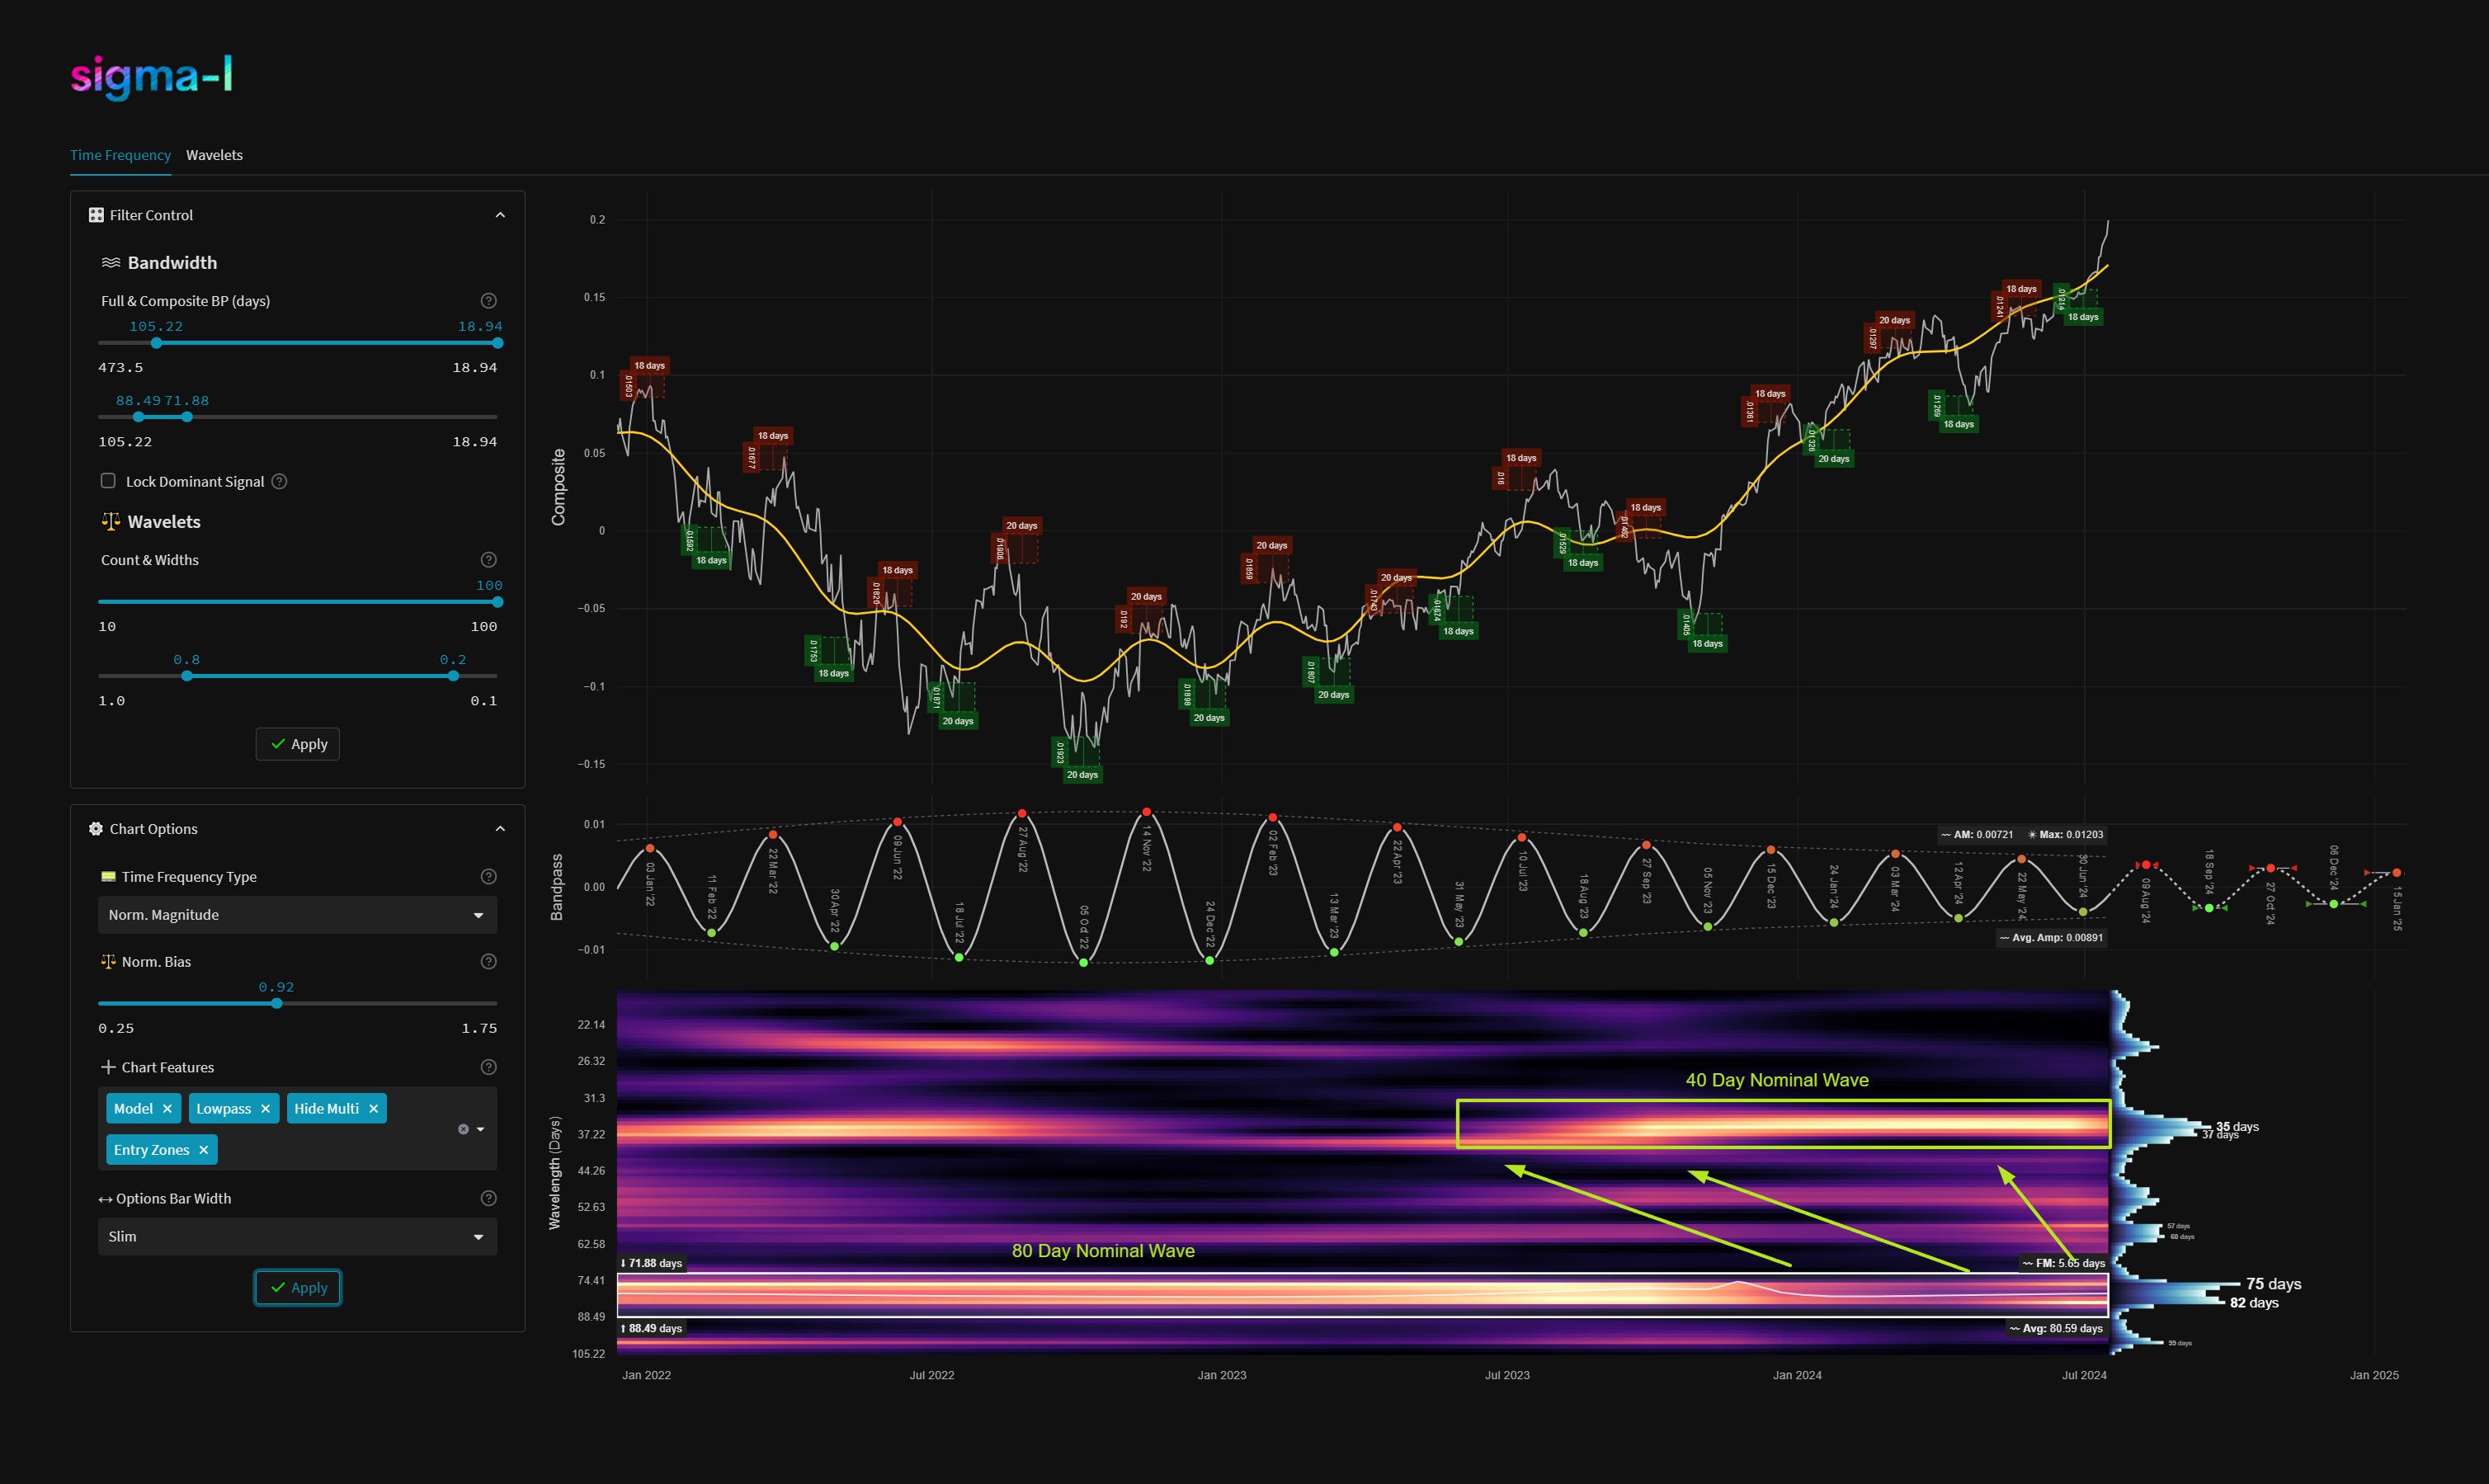
'B' class signal in Sigma-L US stock market composite (Russell 2000, Dow Jones Industrial Average, S&P 500, Nasdaq 100). Avg. wavelength of 81 days since January 2022. Currently hard up.


ΣL Cycle Summary
Taken as a composite (Nasdaq, Russell 2000, S&P 500 and DJIA), this wave has given us a very subtle trough iteration indeed, likely occurring early July. The timing is only really given clarity when we closely examine the same component in the RUT, where it has remained beautifully stationary, as shown below as a separate analysis. Certainly too in the composite chart we can see a divergence occurring over the last few iterations of this wave as power modulates to the component around 35 days average wavelength. Hurst aficionados will of course recognise this cycle as the 40 day nominal wave. It is likely now the 40 week nominal wave will occur mid-late September, assuming a 4:1 ratio (the historically assumed, but somewhat tenuous, harmonicity) with the component being examined in this report.
We will be posting individual analysis for the 40 day wave tomorrow in both the S&P 500 and Nasdaq, given the crucial phase within the larger component and the possibility for a left translated (early) peak. As far as the 80 day component is concerned, subscribers should keep an eye on the Russell 2000 for signs of a peak, given it’s superb clarity, due early August. Depending on the 40 day component, a price peak may well be earlier.