ΣL US Stock Market Composite - 24th September 2024 | @ 36 Days
'A' class signal in Sigma-L US Stock market composite (Russell 2000, Dow Jones Industrial Average, S&P 500, Nasdaq 100). Average wavelength of 36 days since June 2023. Currently peaking


ΣL Cycle Summary
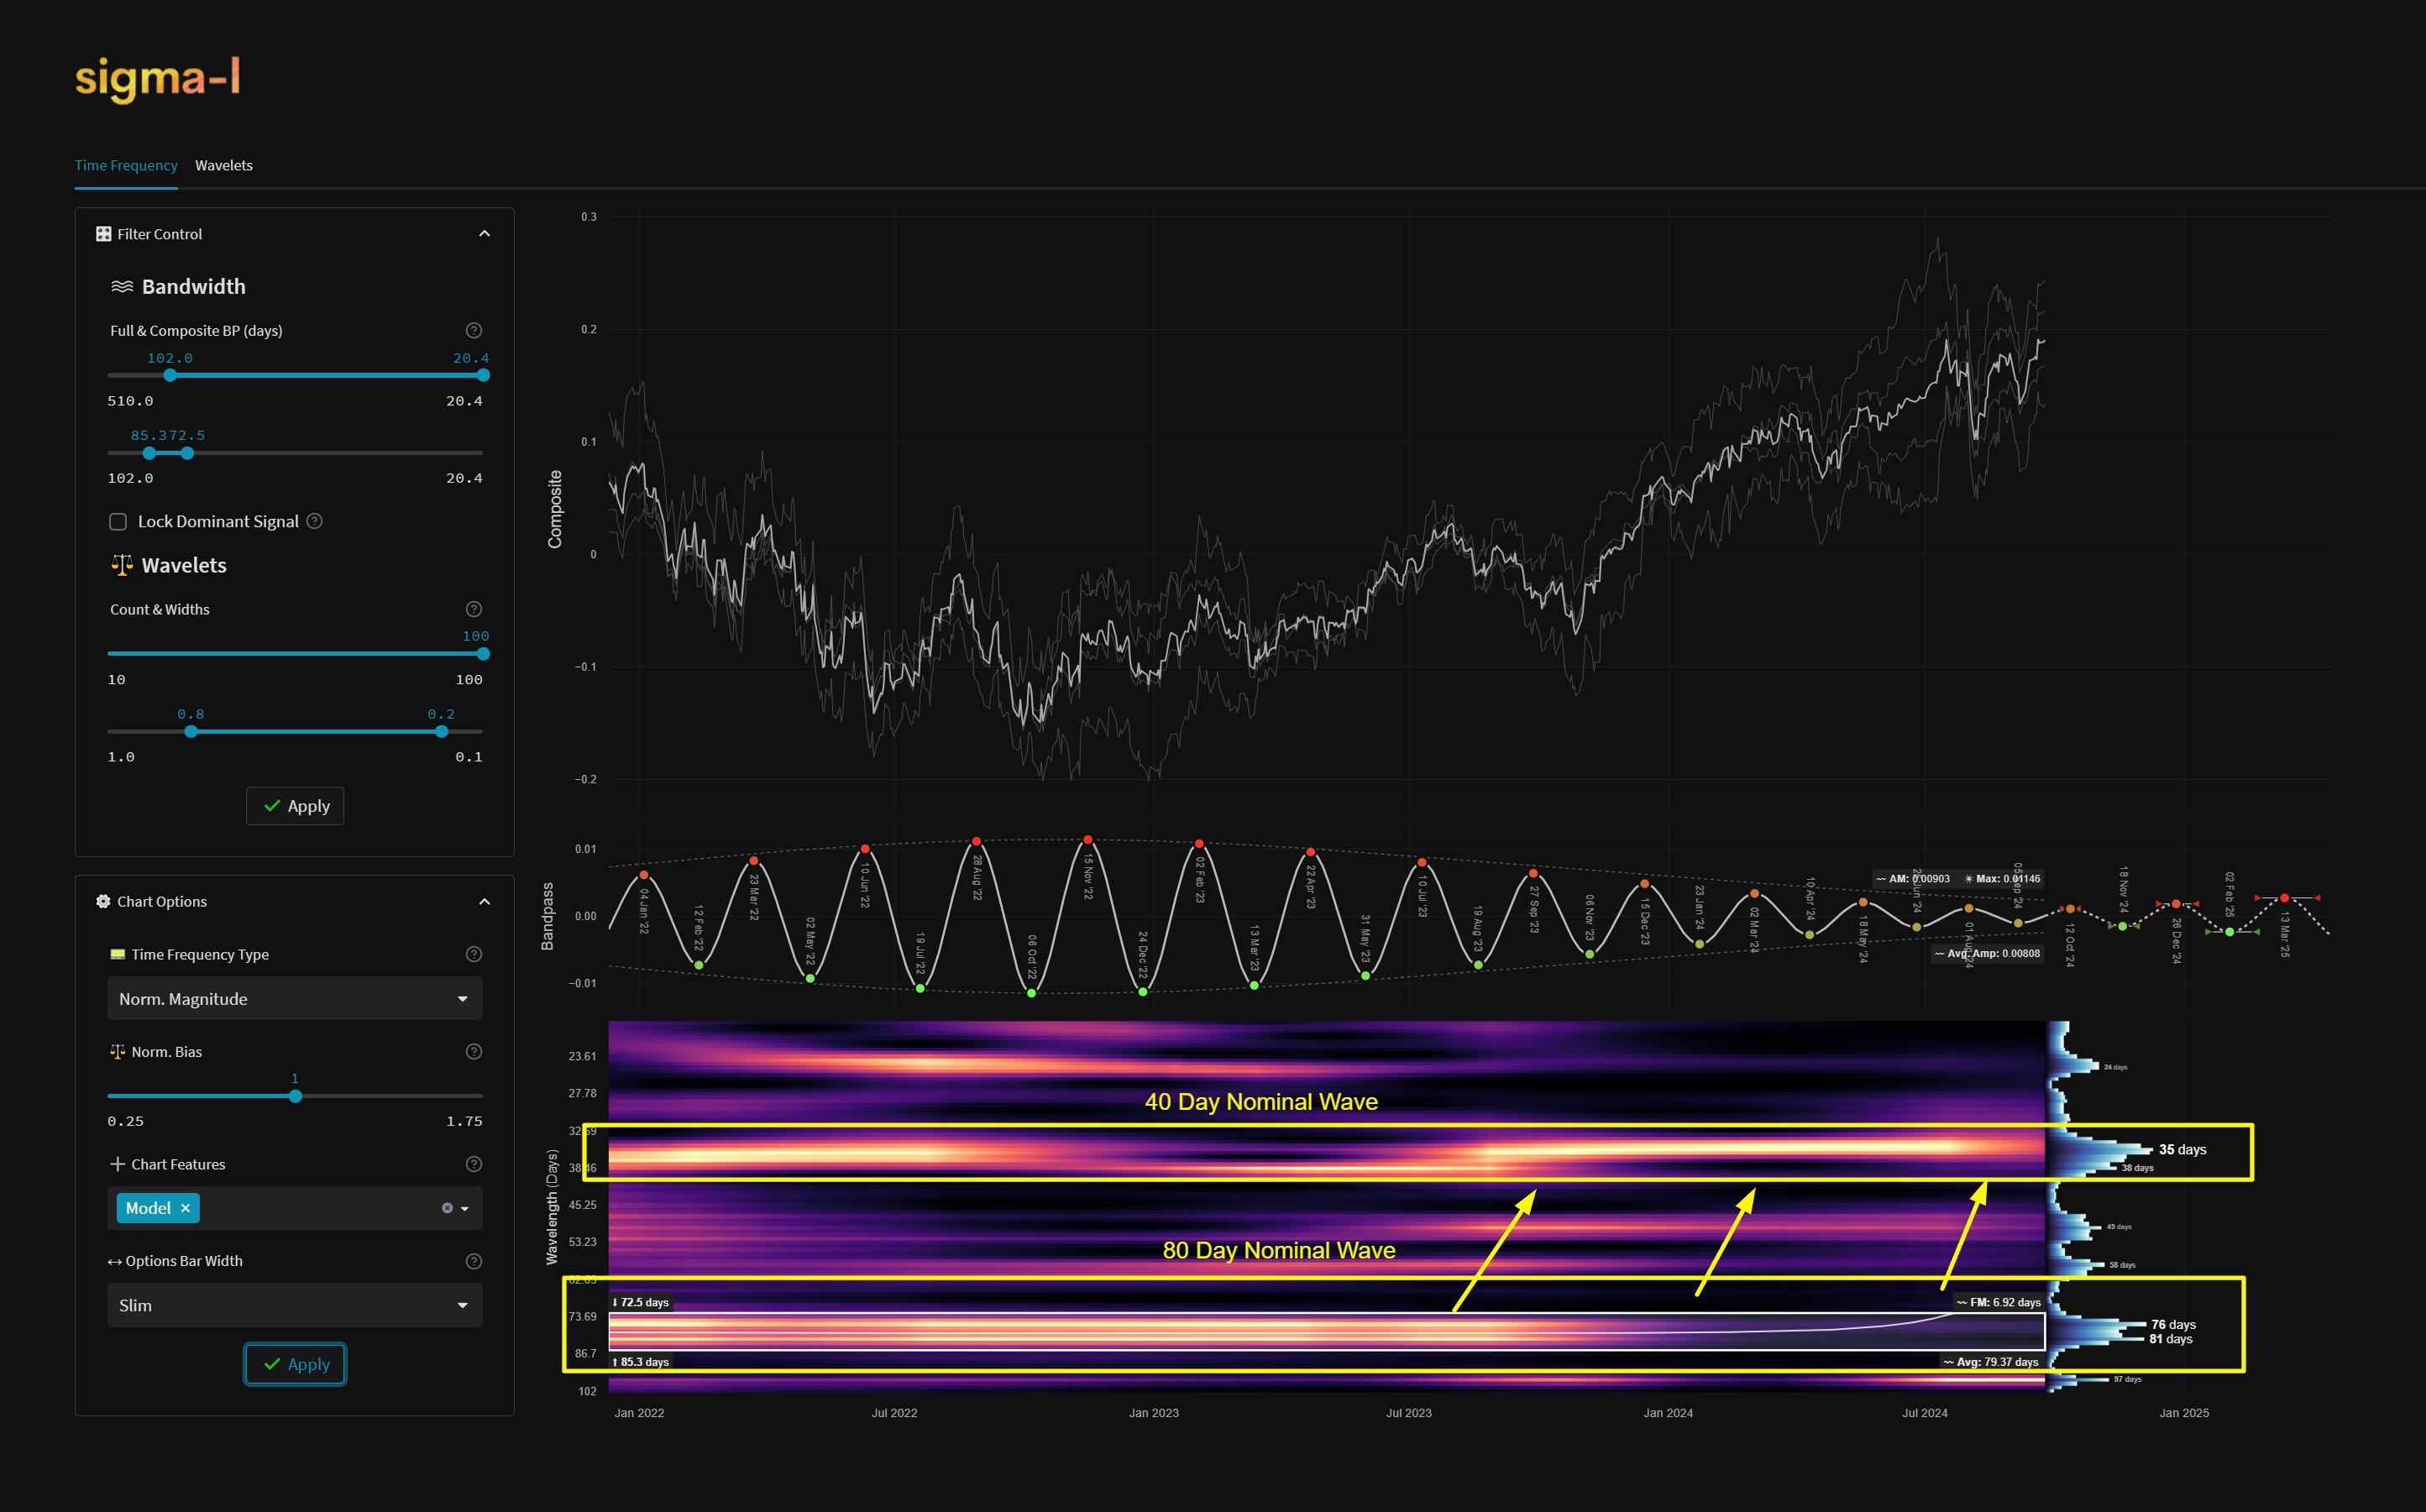
Power continued to seep away from the nominal 80 day wave in stockmarkets worldwide, modulating very obviously to the shorter 40 day nominal wave, most notably in August. It is this wave we look at here and it has shown some quite outstanding periodicity from our sample since mid 2023. A clear spectral spacing in the area of interest within the frequency domain (shown below in both daily and hourly formats) features a large falloff around the power spike, centred at 36 days average wavelength. This is a sublime feature over many years and is a central reason for the signal receiving an ongoing ‘A’ category rating. The current phase is classed as peaking and it will be fascinating to see whether power is retained once again in the down leg. If it is, we can expect a similar price move range as the recent up leg from the trough earlier in September.