


Video Summary
The video above, presented without commentary, provides a look into the Dollar Index via the microscope of complex wavelet convolution. Wavelet convolution is one of the more precise methods of time series decomposition available today and well suited for extracting modulating, periodic components from noisy data sources.
We start at a wide ranging, long term bandwidth between the year 2003 to 2023. This includes wavelengths spanning 2400 days to 150 days and is excellent in identifying the prominent periodicity of the ‘nominal’ 54 month component at around 40 months and the ‘nominal’ 18 month component at around 19 months. It is clear, as we mentioned in our last report into the Dollar Index, that there is likely a 2:1 harmonic ratio between this smaller component and the component at 40 months. We examine the magnitude and phase time series of the total bandwidth, noting significant phase alignment (waves are synchronised) at large peaks and troughs over the timeframe.
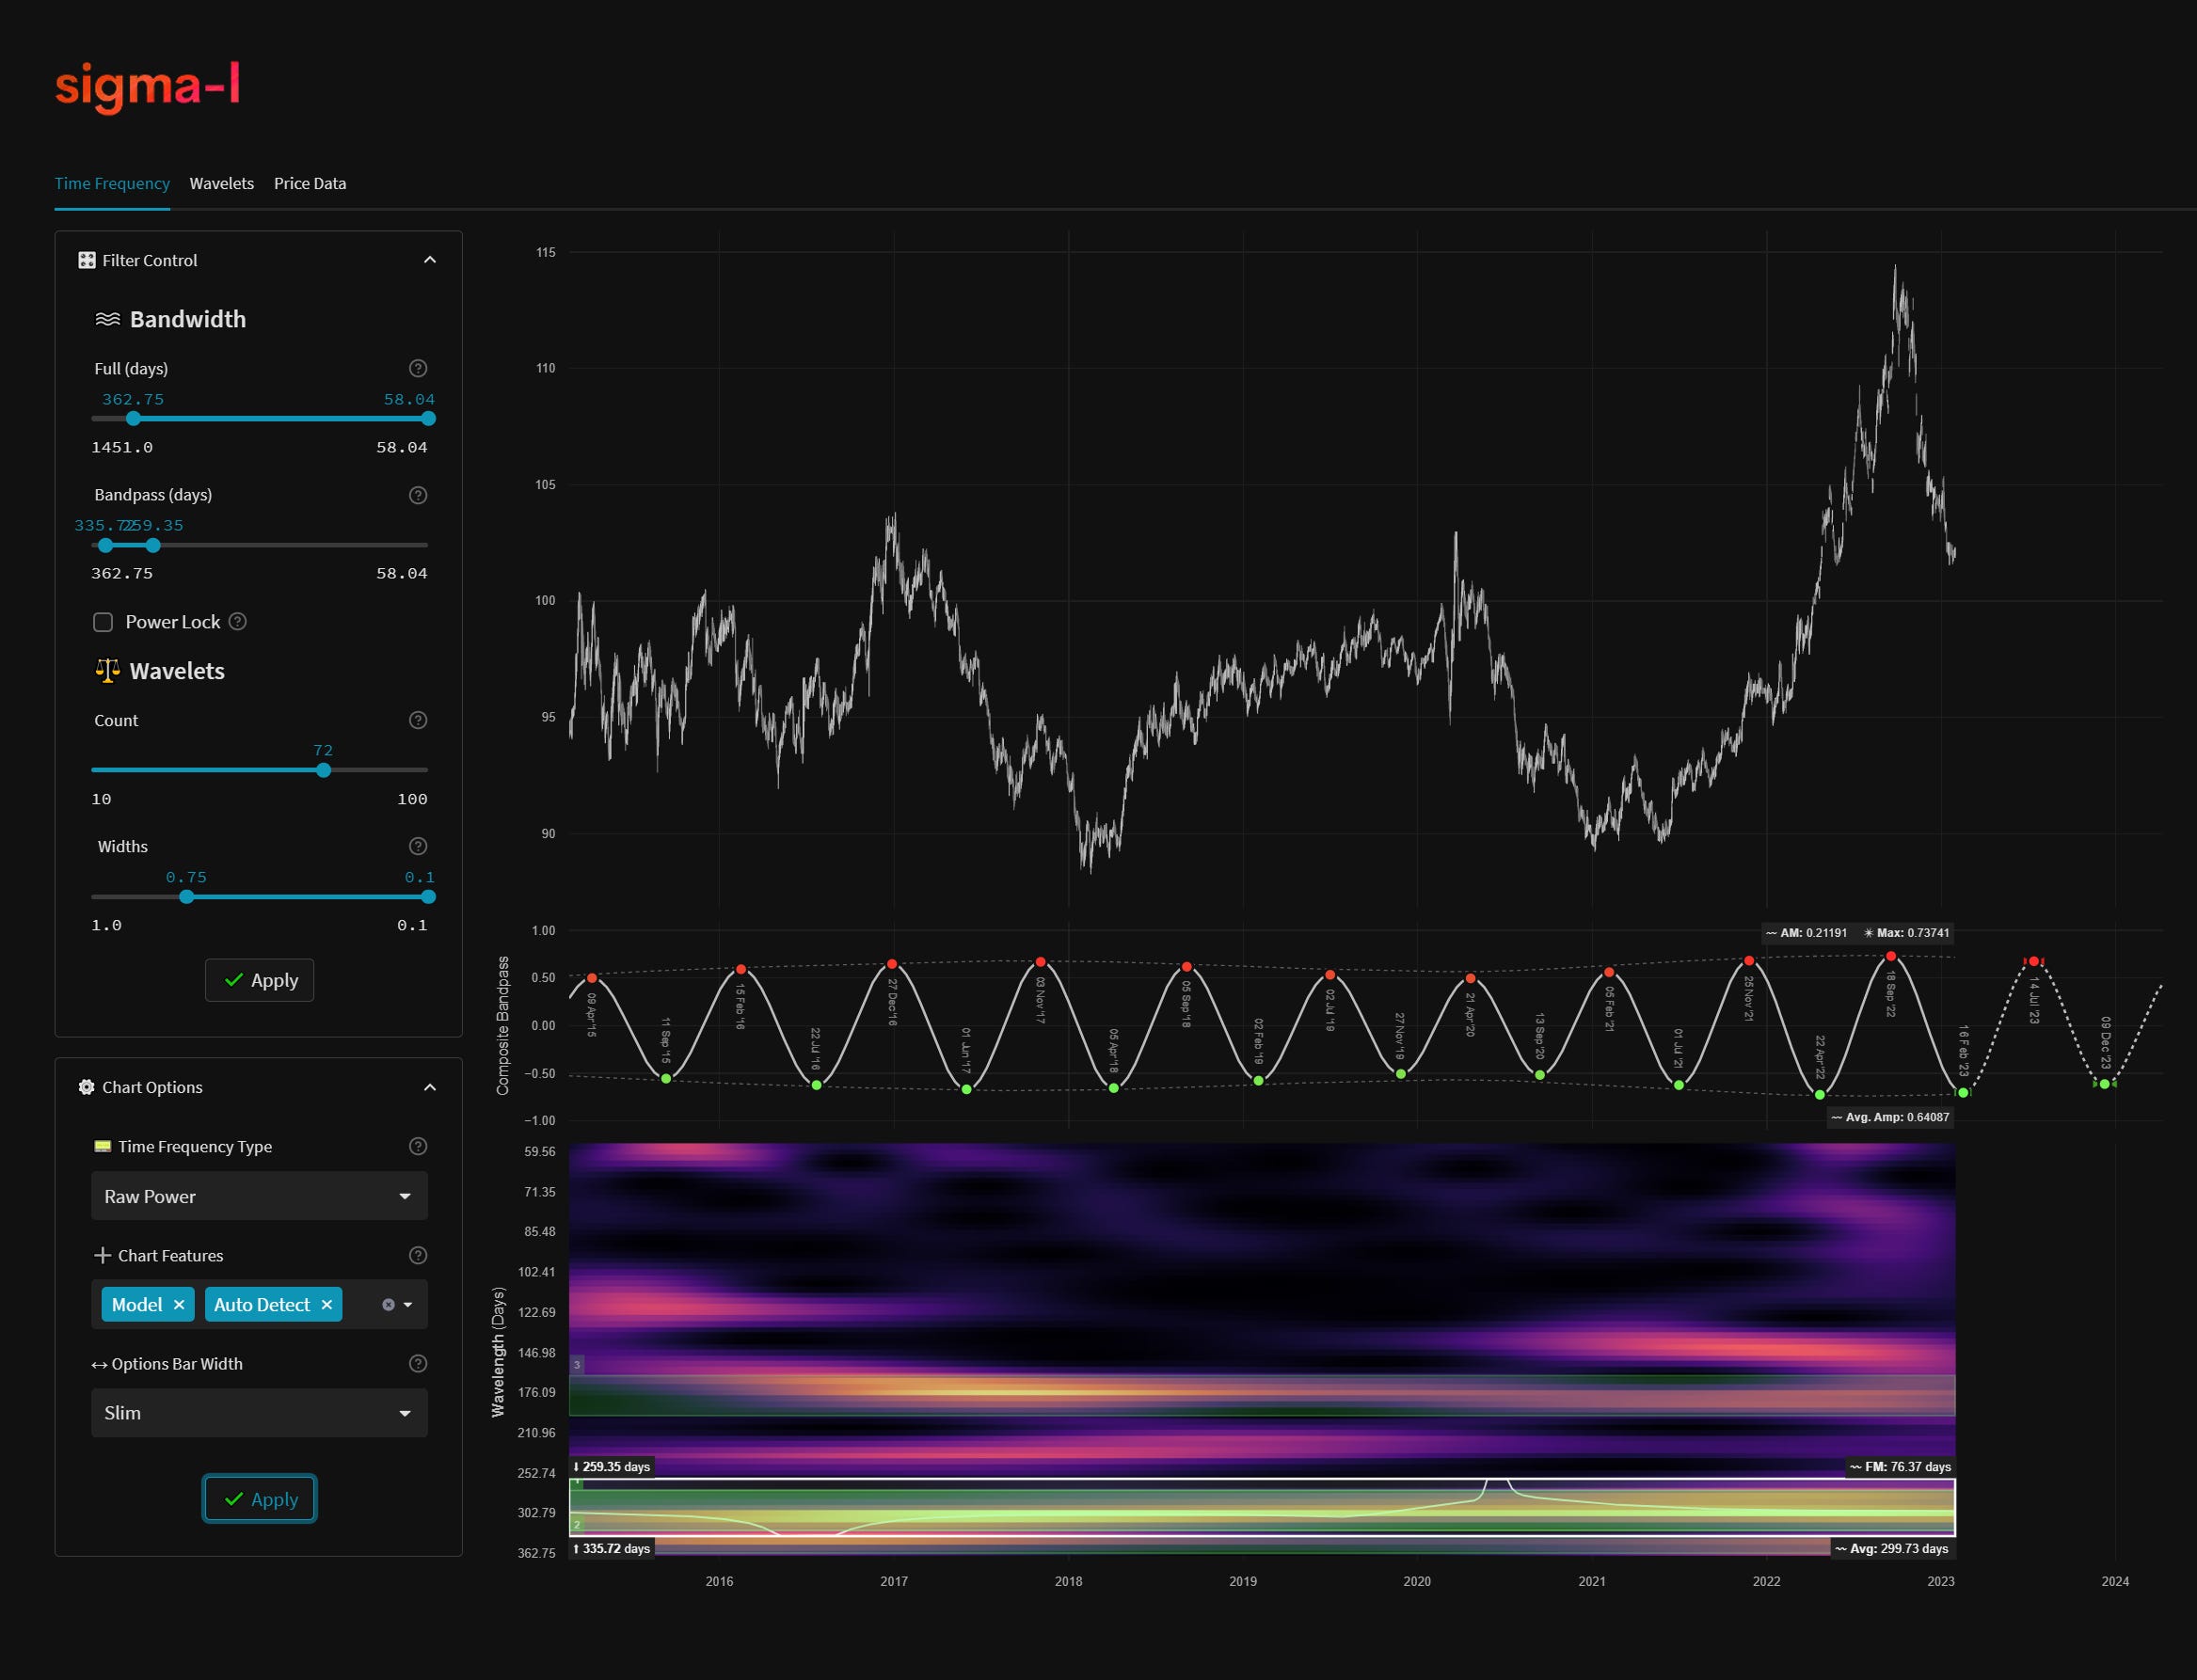
The next part of the video (around 5 minutes) looks at the medium term components, namely the ‘nominal’ 40 and 20 week components. The 40 week component is relatively easy to identify with stationary power across the timeframe selected. We look at the phase clustering (synchronisation) across the bandwidth of 322 days to 58 days. The 20 week component is harder to quantify with significant attenuation from the larger components and modulation across frequencies from around 190 days to 140 days. We attempt to capture this modulation with a wider bandpass region.
Finally, at around 8 minutes, we sweep down to the bandwidth between 100 days to 20 days and use the auto detection feature to identify the 80 day ‘nominal’ component. We also examine a candidate for the 40 day wave, running at around 34 days average wavelength. We plot a smoothed FLD for these components as a potential entry point.
Phasing Analysis
Long Term
Components including and longer than the 18 month nominal wave

Medium Term
Components between the 20 week to 18 month nominal wave

Short Term
Components shorter than the 20 week nominal wave


