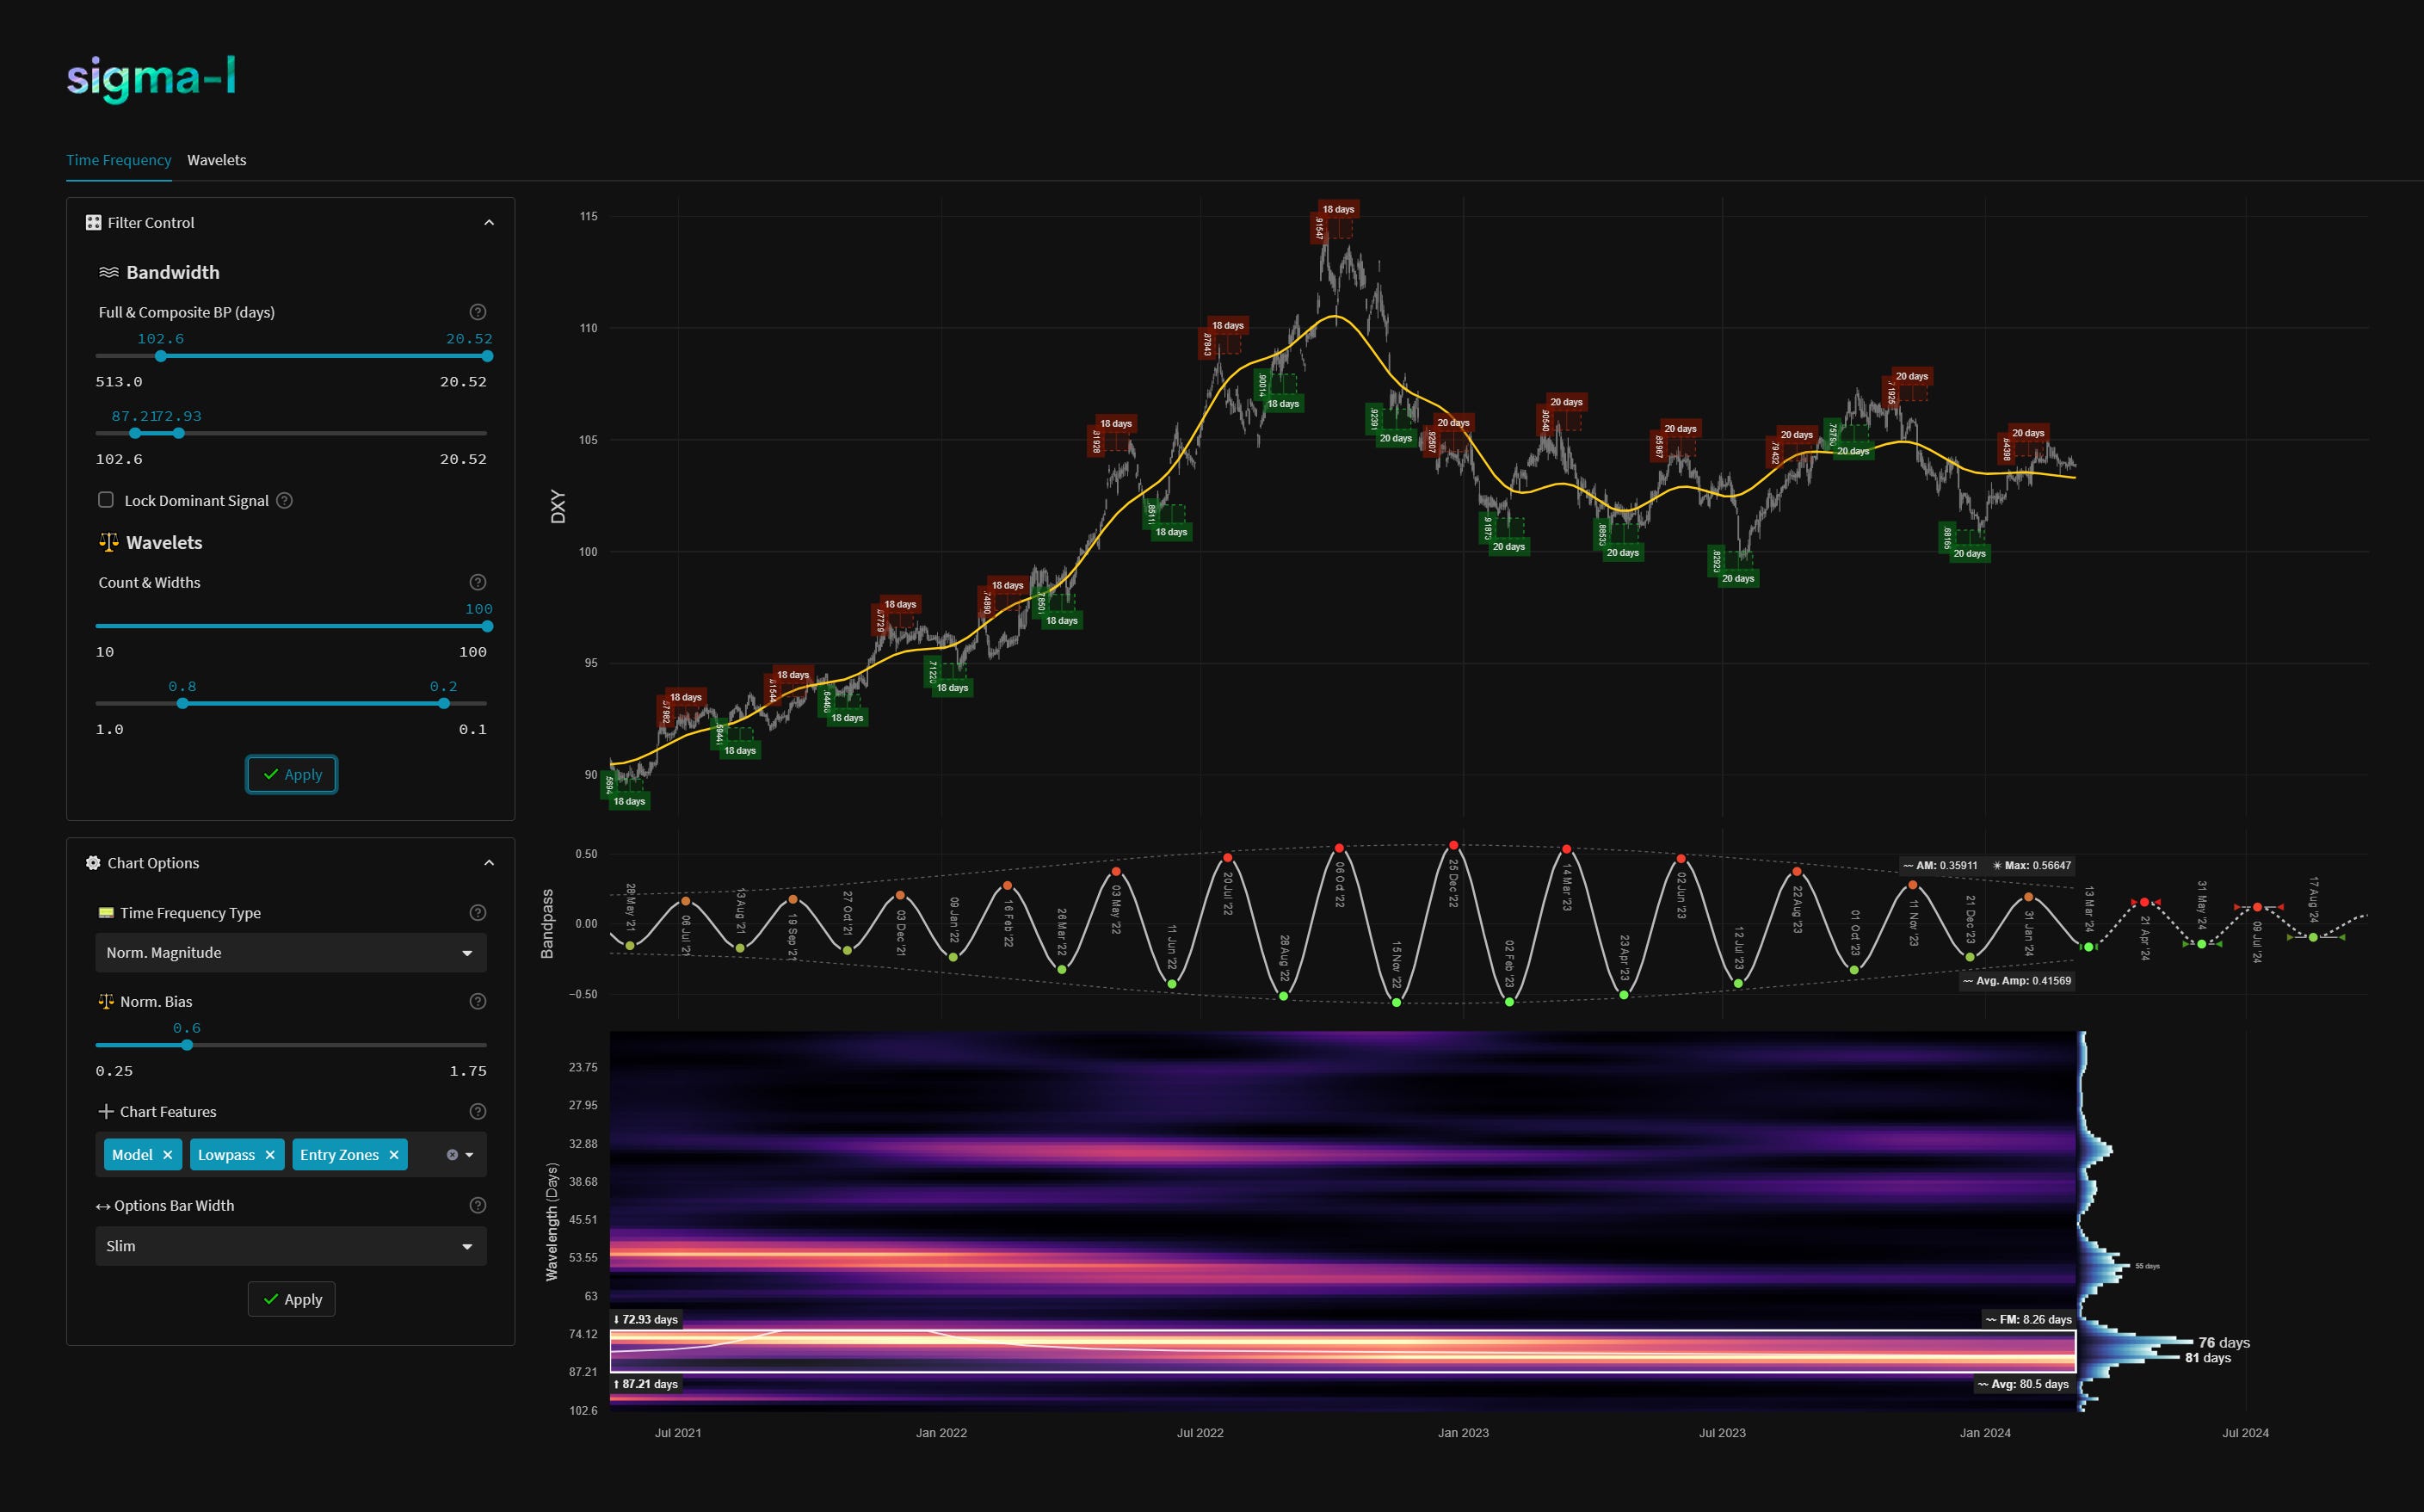
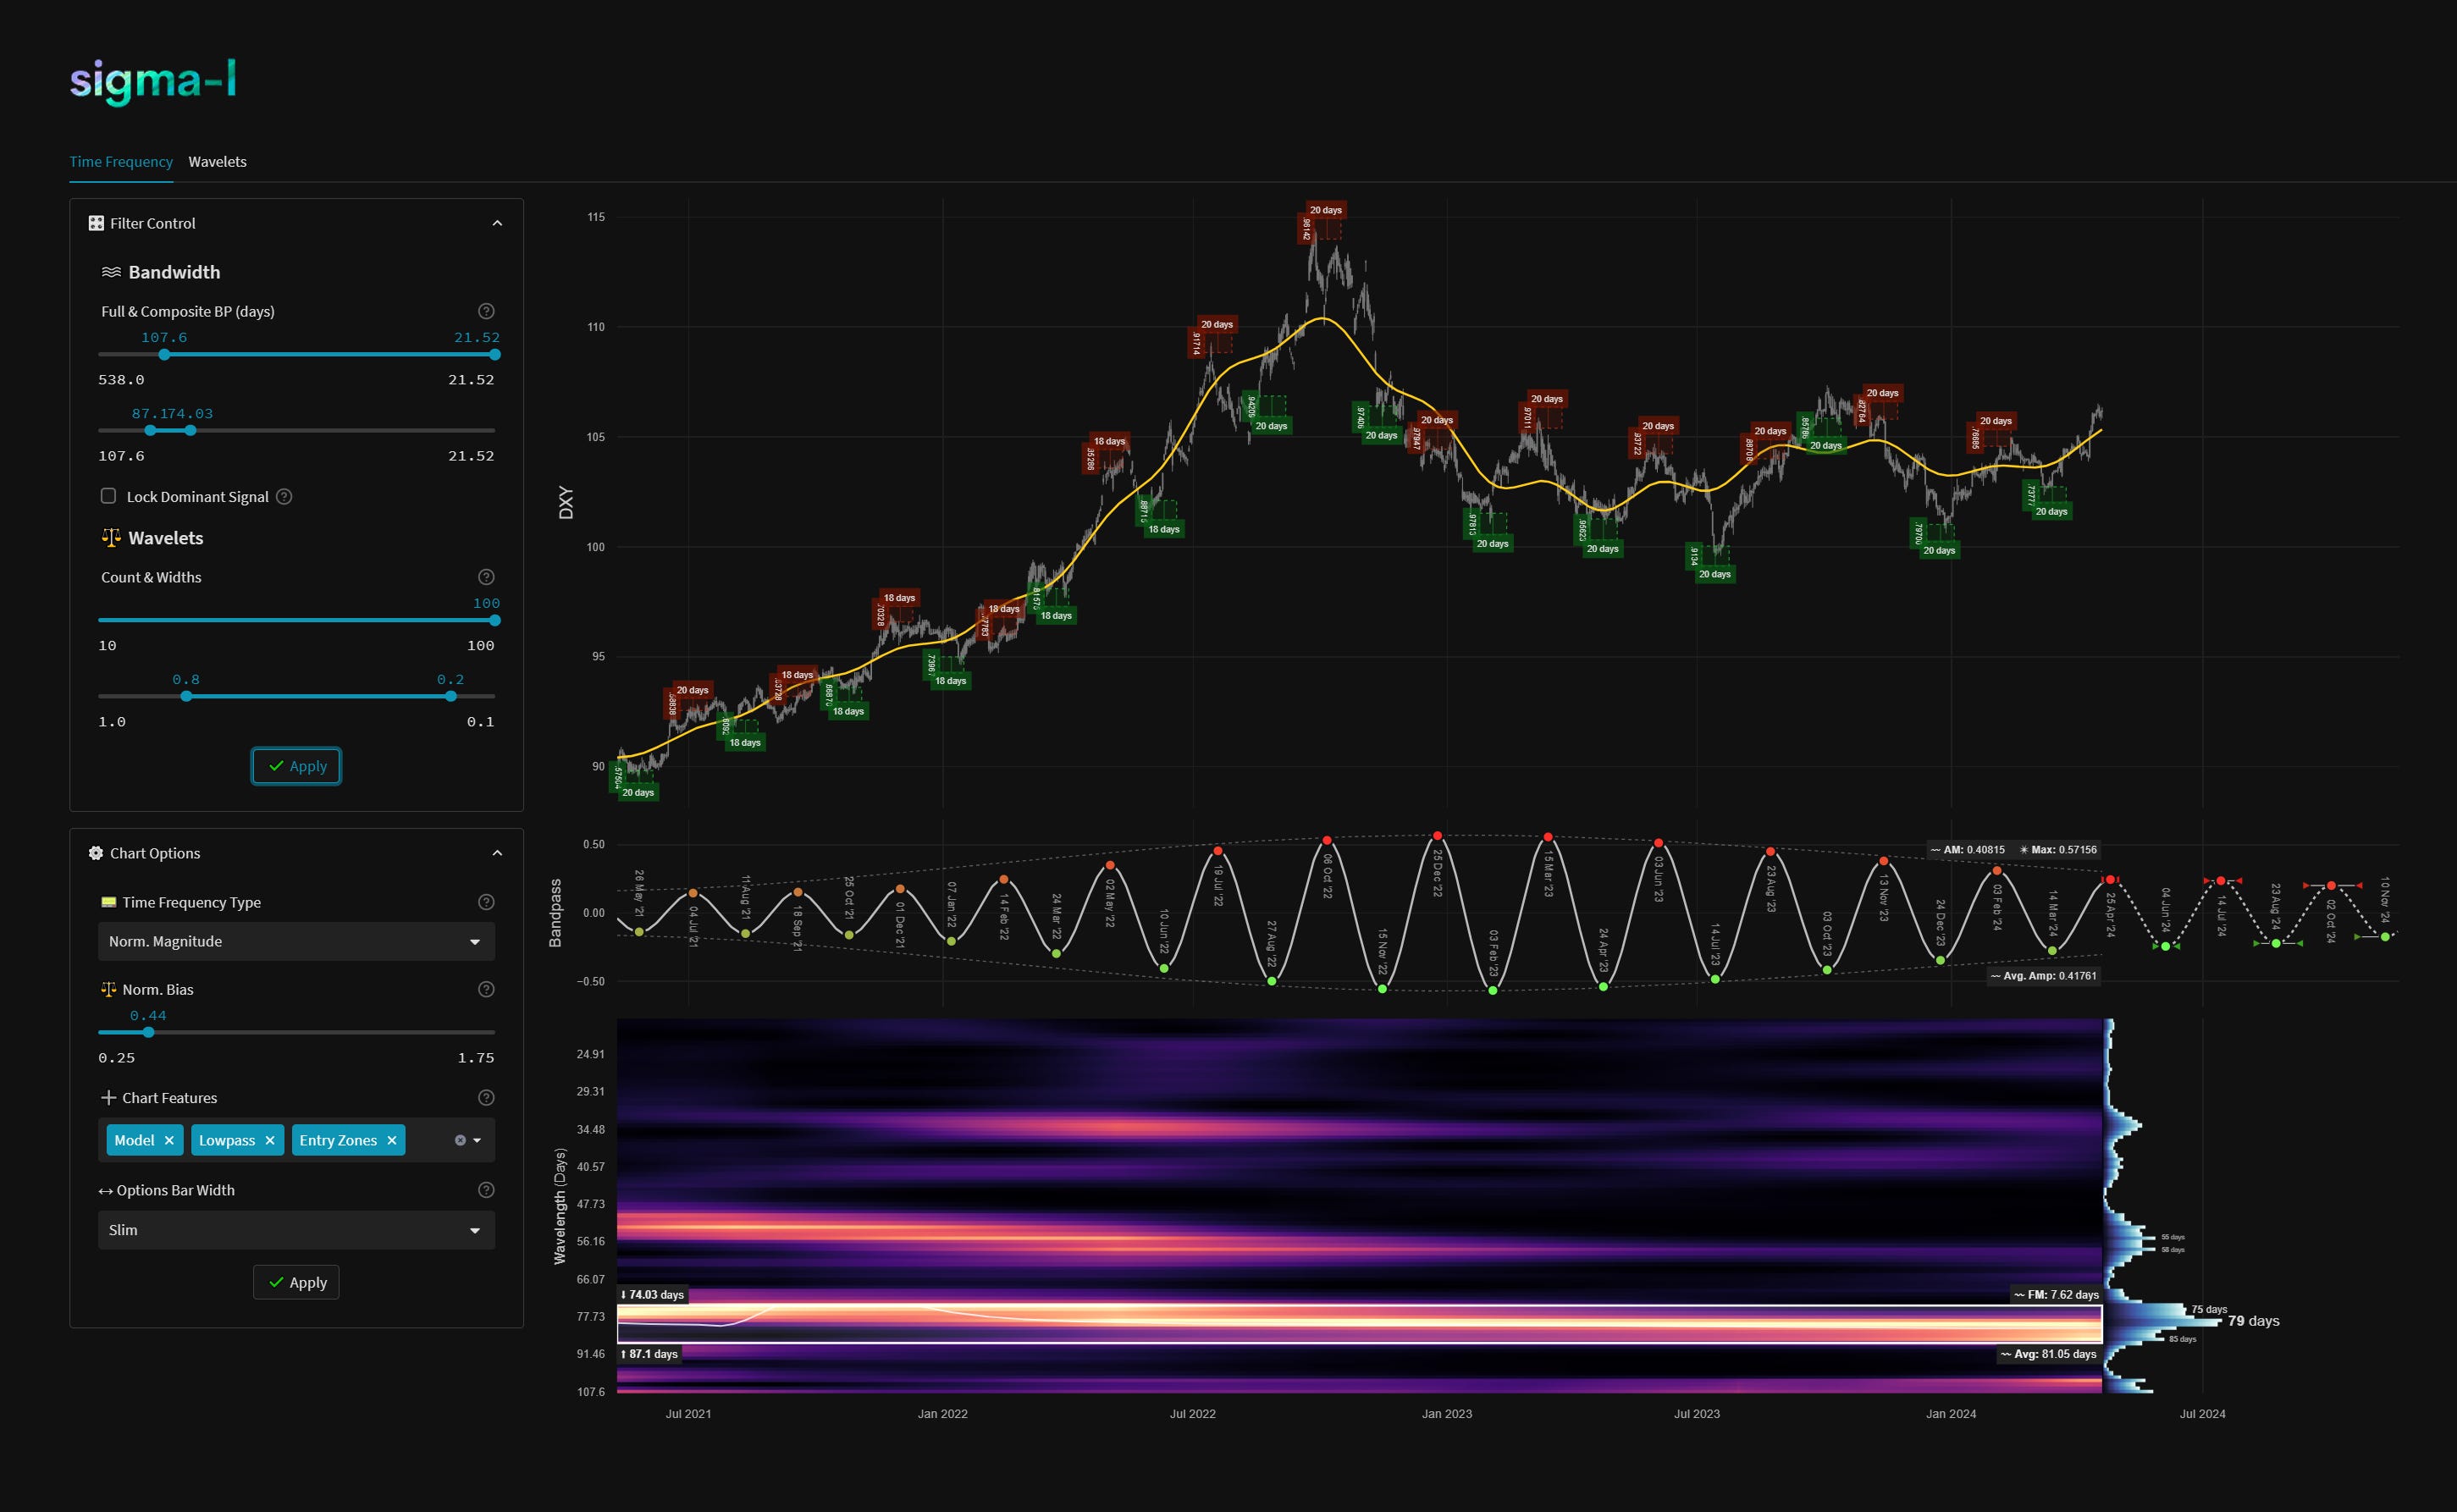
US Dollar Index - 21st April 2024 | @ 81 Days | + 2.23%
Last trade: + 2.23% | 'B' class signal detected in US Dollar Basket / Index. Running at an average wavelength of 81 days over 14 iterations since May 2021. Currently peaking


Before and After
Signal comparison between our last report and the current time, in chart format.