US Dollar Index - 12th February 2024 | @ 601 Days | + 0.62%
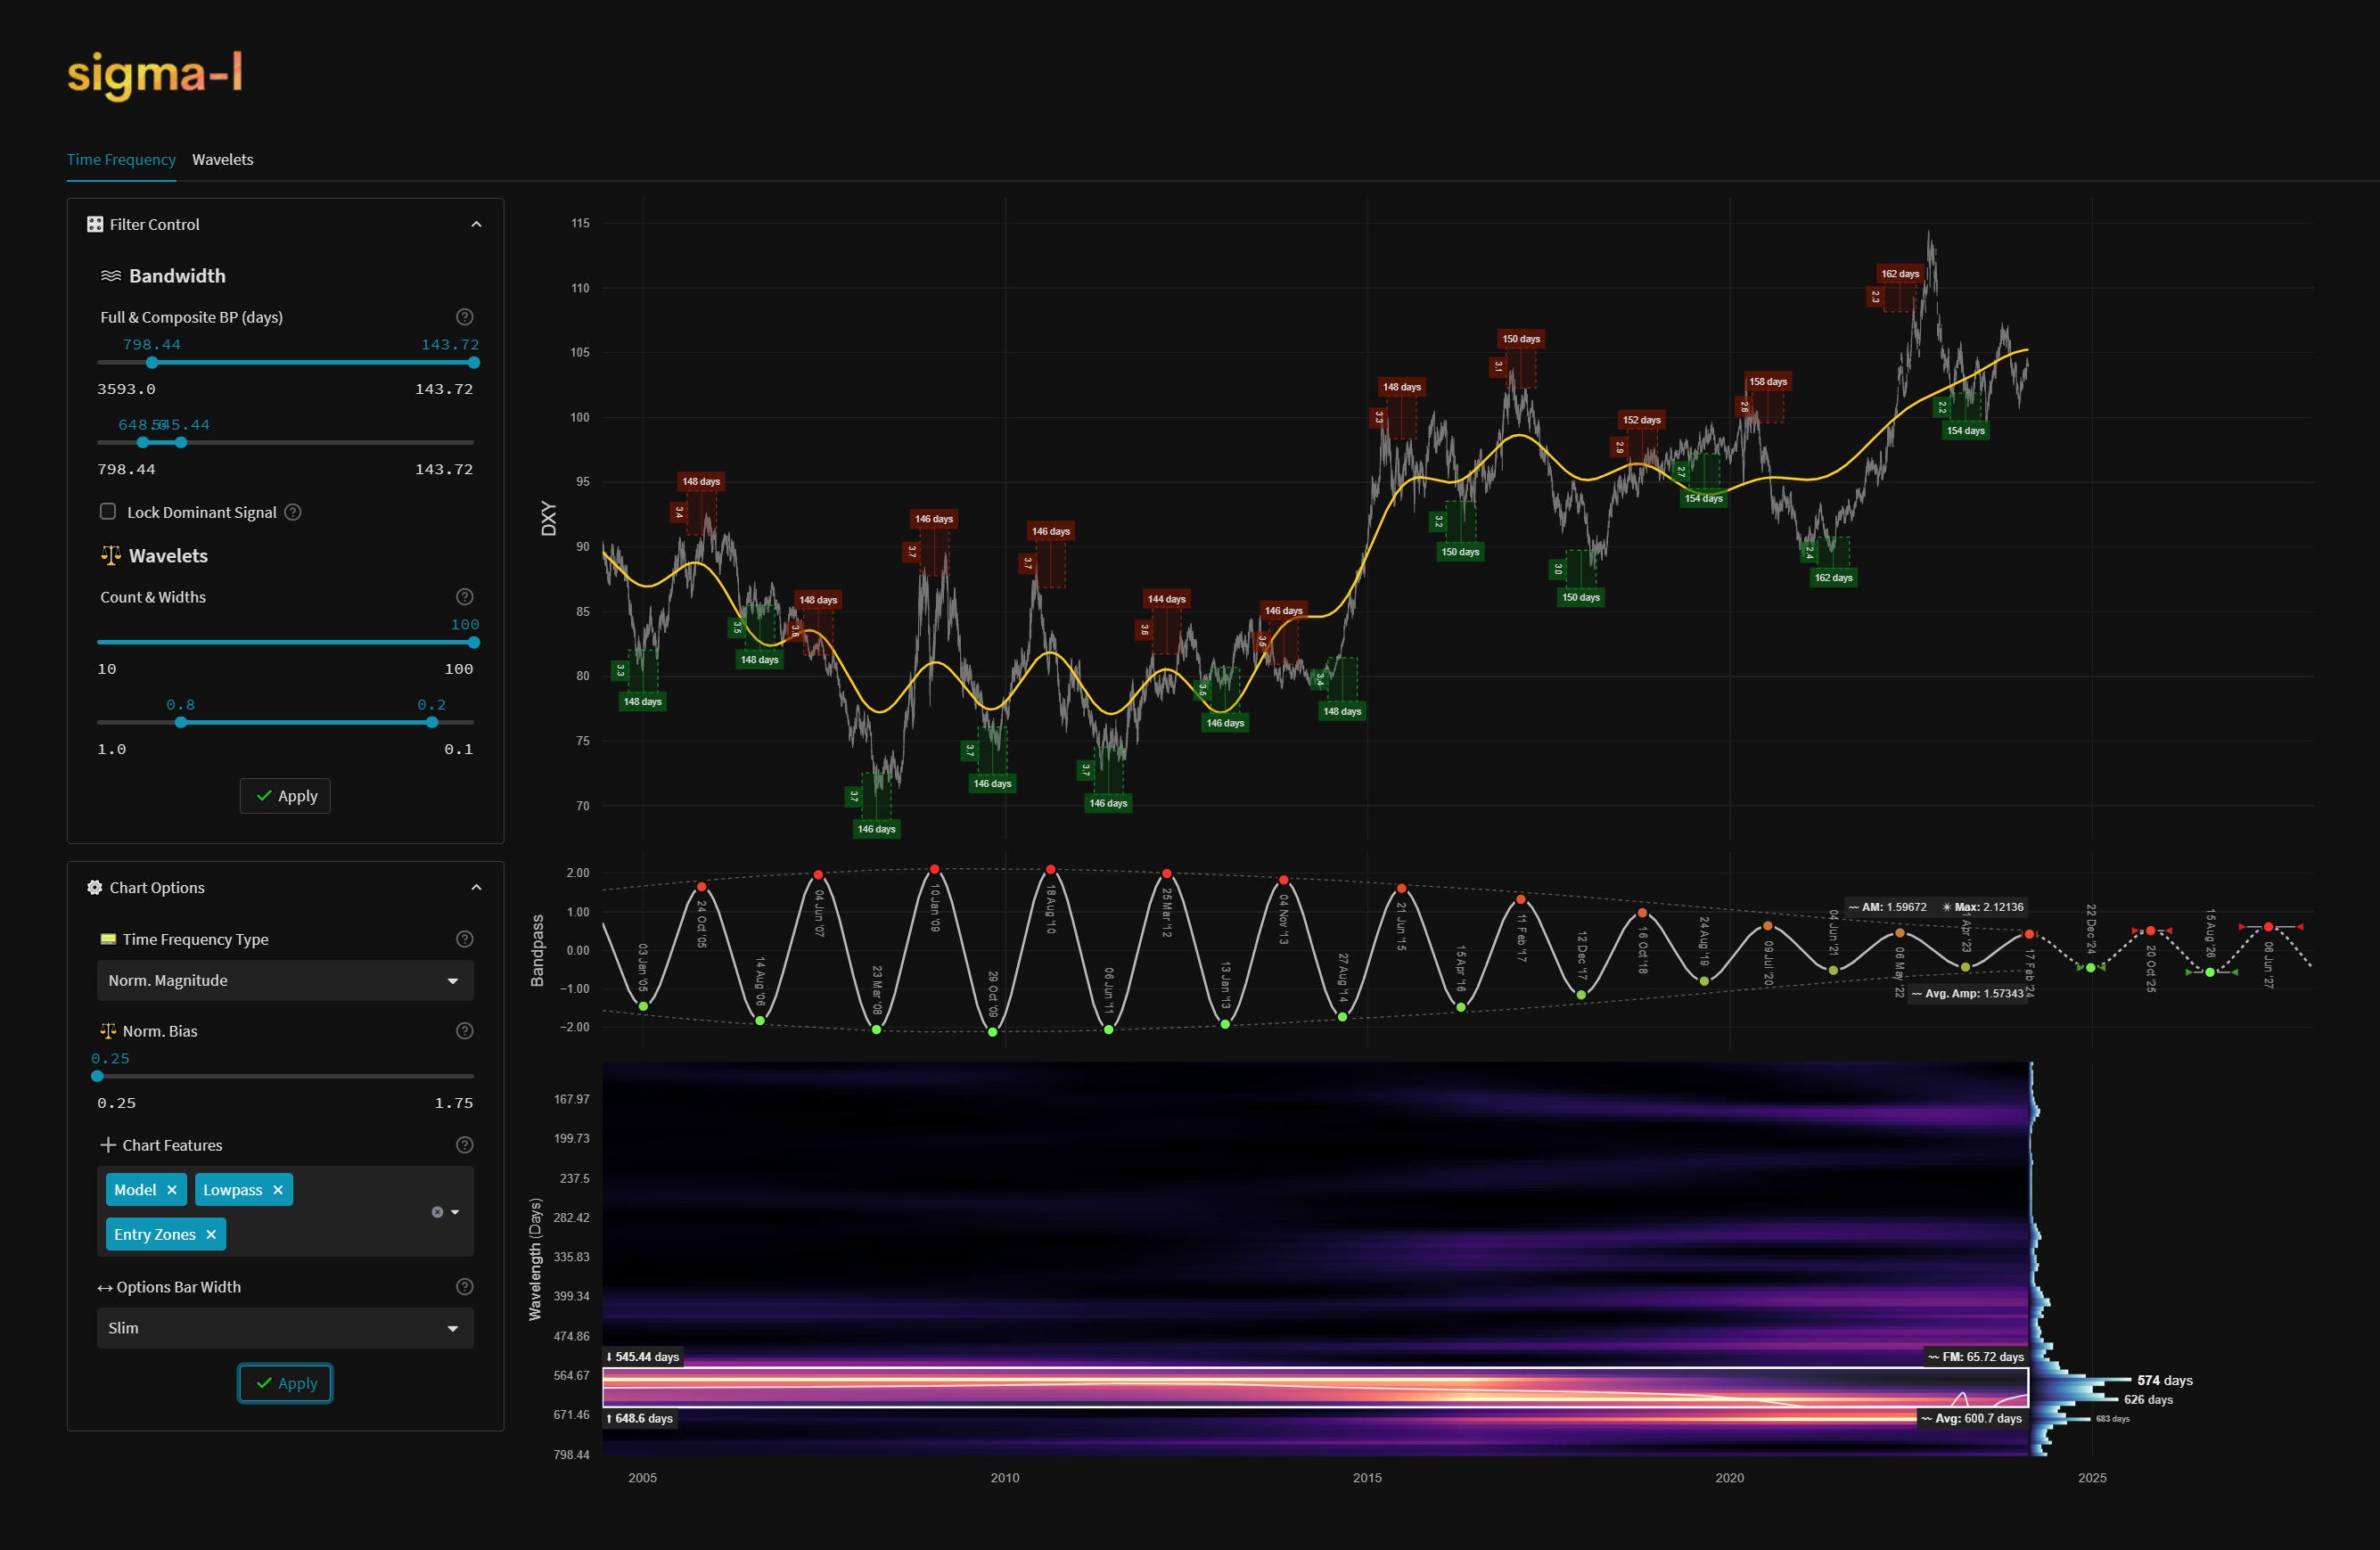
Last trade: + 0.62% | 'C' class signal detected in US Dollar Basket / Index. Average wavelength of 601 days (19.75 months) over 12 iterations since July 2004. Currently peaking.


ΣL Cycle Summary
The latest up swing of this long term component in the Dollar Index was largely flat, likely reflecting the downward pressure being exerted by the next longer component around 3.4 years. That wave is due to trough toward the end of 2024 and is currently hard down (shown below in time frequency analysis). The wave detailed here is also due to trough toward the end of the year and form a powerful phase cluster with the longer wave, which makes this current peaking process quite crucial! A strong harmonic relationship exists for the Dollar Index at these two scales, as we mentioned briefly in the last report, with the wave around 600 days exhibiting a clear 2:1 relationship with the longer component around 1200 days. True synchronicity of periodic components in financial markets is a myth but they do form clusters of peaks and troughs, such is the case here. This signal is currently rated a high ‘C’, it may well receive an upgrade late in the year when we report on it’s progress and the incoming trough.
Trade Update
See also: Live ΣL Portfolio & History
Summary of the most recent trade enacted with this signal and according to the time prediction detailed in the previous report for this instrument, linked below.
Type: Late Buy - US Dollar Index 14th June 2023
Entry: 14th June 2023 @ 103.15
Exit: 12th February 2024 @ 103.79
Gain: 0.62%
Before and After
Signal comparison between our last report and the current time, in chart format.