Crude Oil Volatility (OVX) - 20th February 2024 | @ 52 Days | + 7.5%
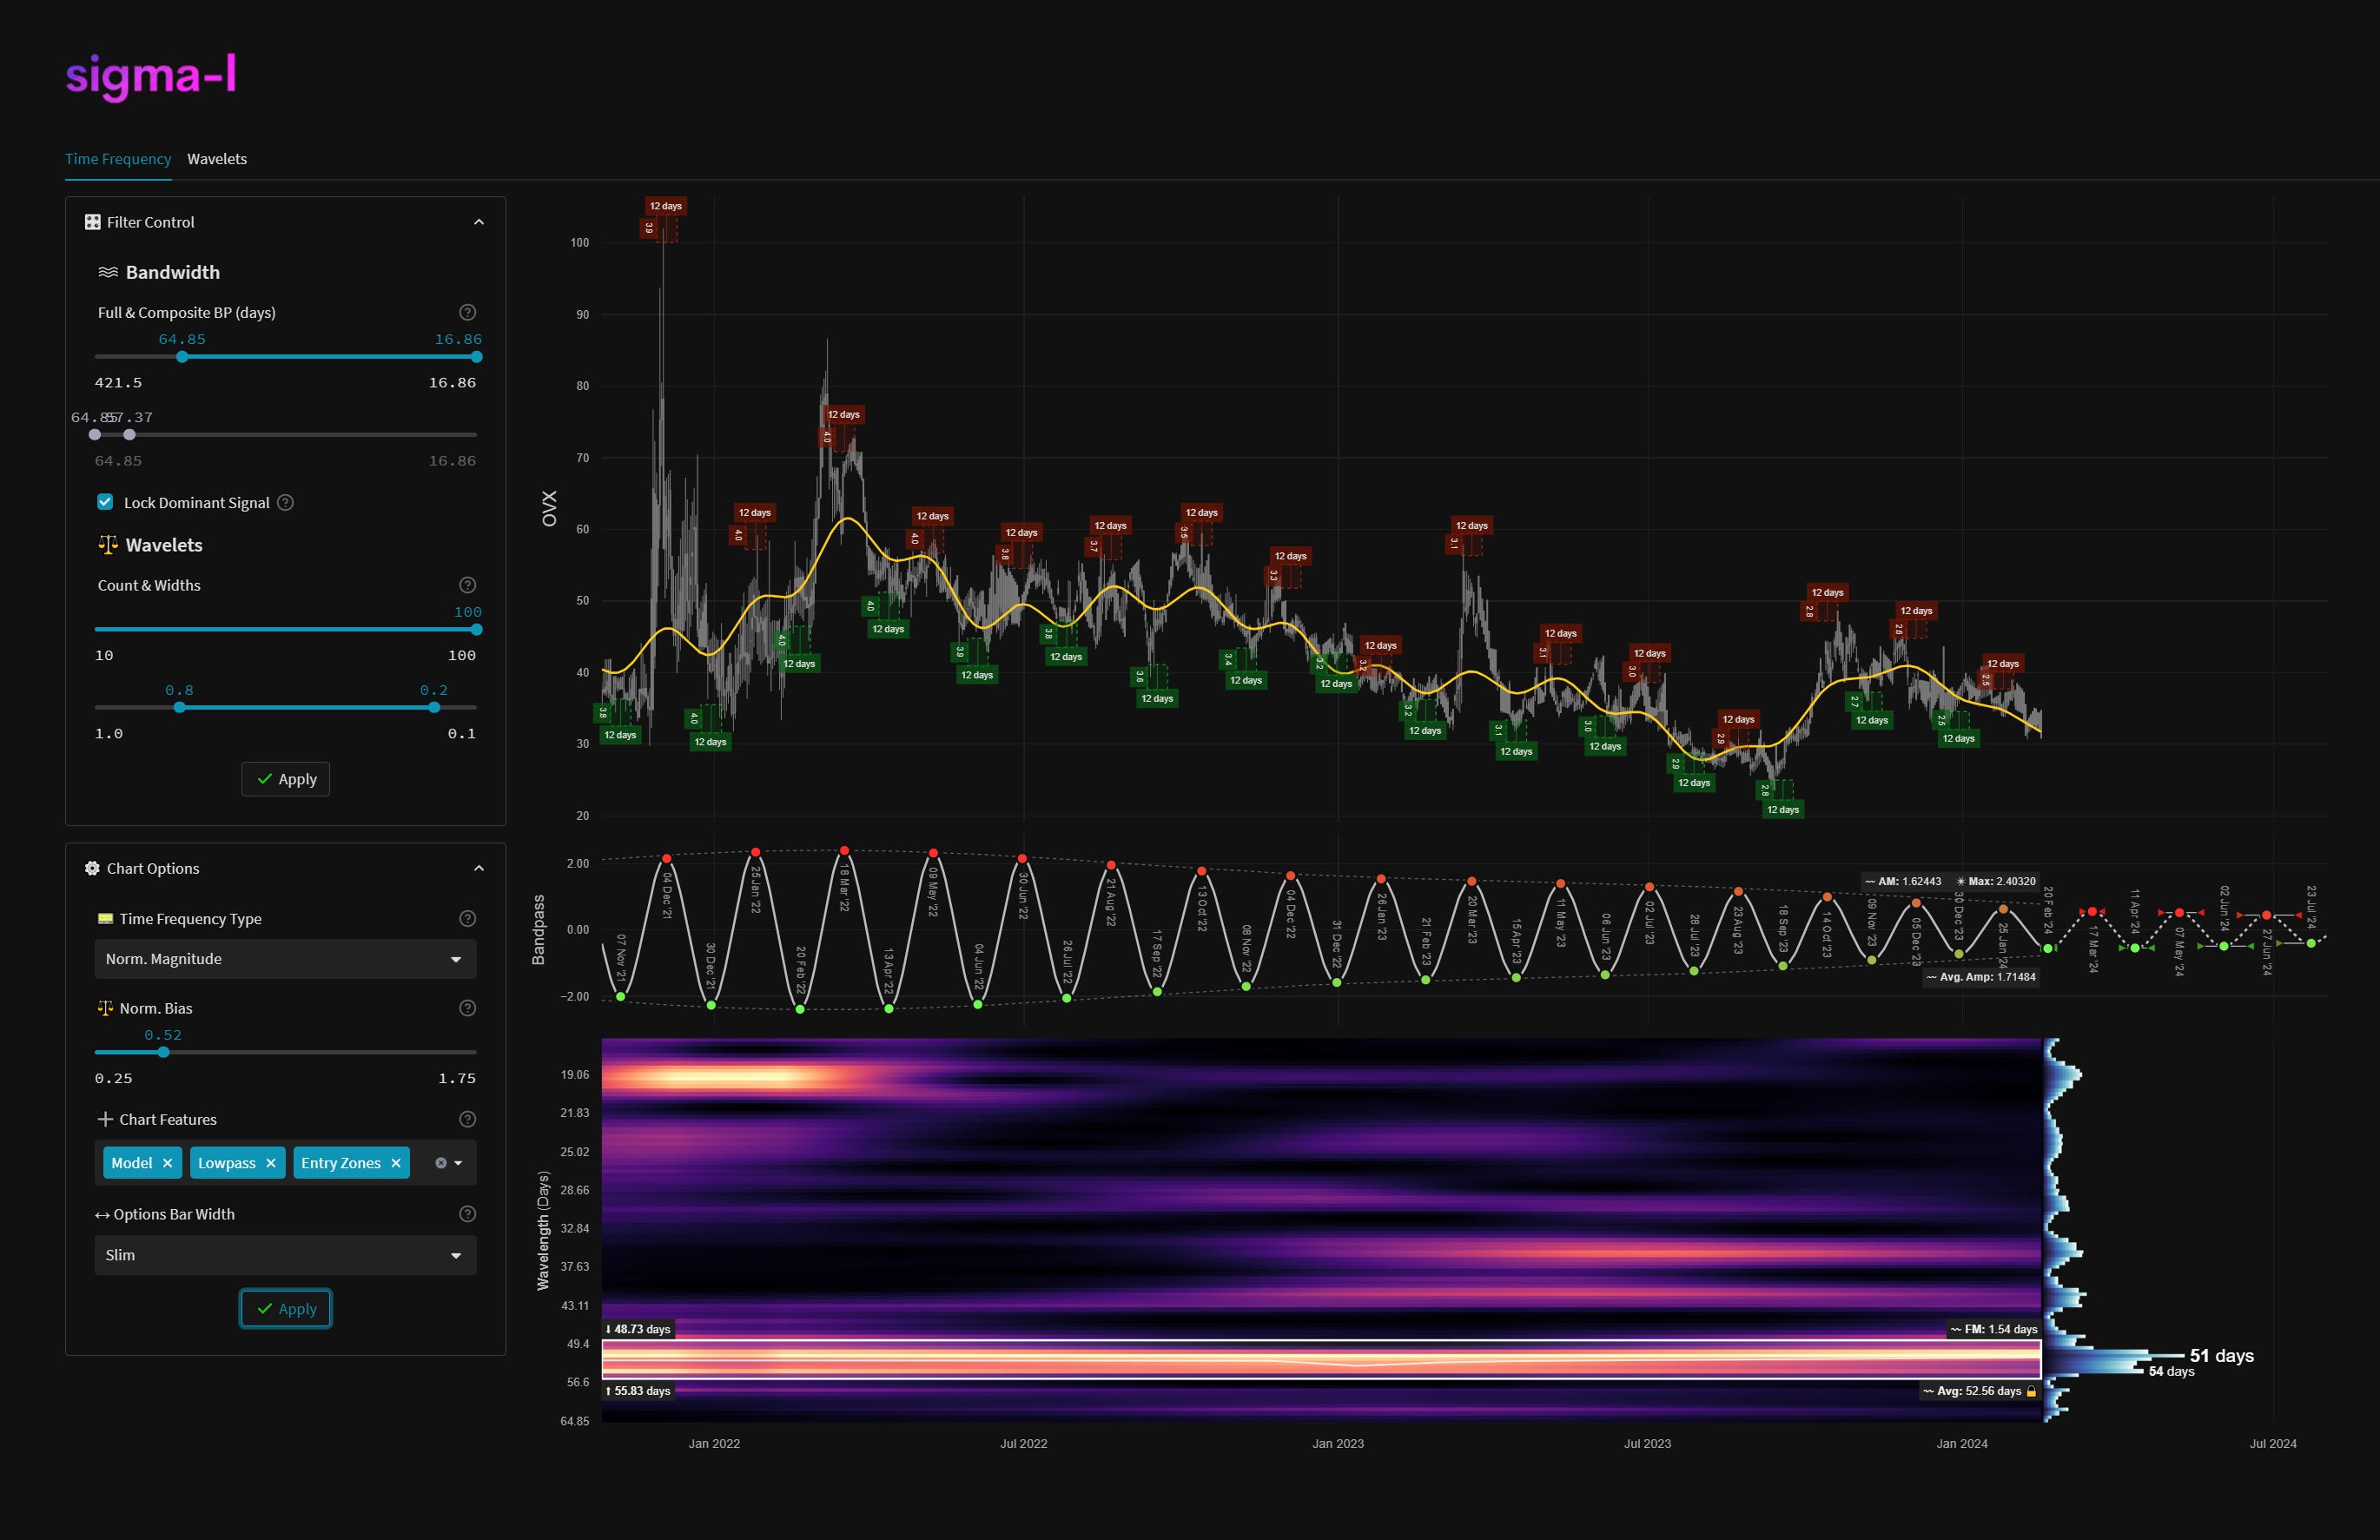
Last trade: - 4.56% | 'A' class signal detected in CBOE Crude Oil Volatility Index. Average wavelength of 52 days over 16 iterations since October 2021. Currently troughing.


Instrument Summary
The OVX, or CBOE Crude Oil Volatility Index, measures the market's anticipation of future fluctuations in crude oil prices. It is calculated based on the prices of options contracts for oil, which are used by investors as insurance against price swings. Higher OVX values indicate increased expected volatility, reflecting uncertain market conditions, while lower values suggest a more stable outlook. The index provides valuable insights into investors' sentiment and risk perception regarding oil prices.
ΣL Cycle Summary
An uneventful move down for the latest down leg of the prominent wave around 50 days here in the OVX, anticipated from the previous component peak in mid-late January. Amplitude is slightly up on the last report although, as is easily discernible on the time frequency plots below, overall amplitude is gently diminishing over time for this particular periodic feature. Regardless, this continues to be a largely excellent frequency stationary signal, readily detected.
Trade Update
See also: Live ΣL Portfolio & History
Summary of the most recent trade enacted with this signal and according to the time prediction detailed in the previous report for this instrument, linked below.
Type: Sell - Crude Oil Volatility 26th January 2024
Entry: 26th January 2024 @ 34.78
Exit: 20th February 2024 @ 32.17
Gain: 7.5%
Before and After
Signal comparison between our last report and the current time, in chart format.