Bitcoin: Hurst Cycles - 7th Jan 2022
BTCUSD | Phasing Analysis Update, Outlook & Trading Strategy
Tools required: Nominal Model | FLD | FLD Trading Strategy | FLD Trading Strategy (Advanced)
Phasing Analysis
Long Term
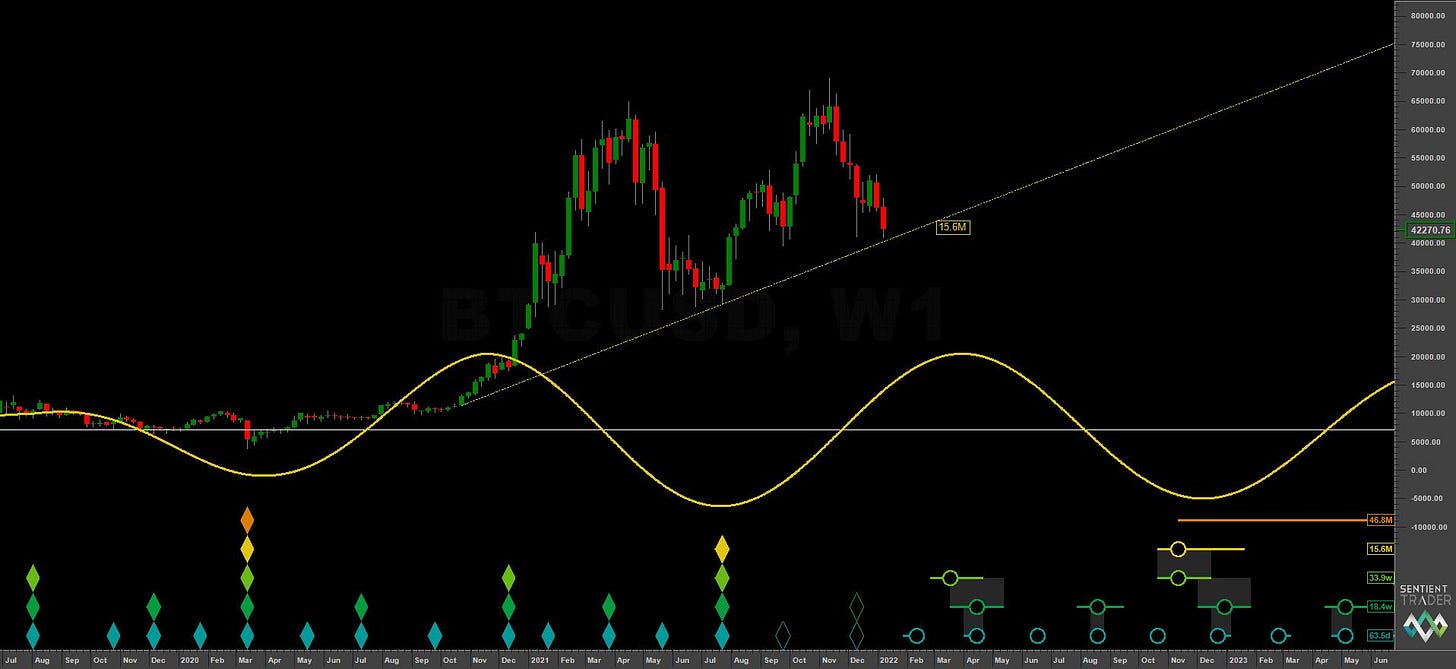
Components greater than and including the 18 month nominal cycle.
Medium Term
Components less than and including the 18 month nominal cycle.
Short Term
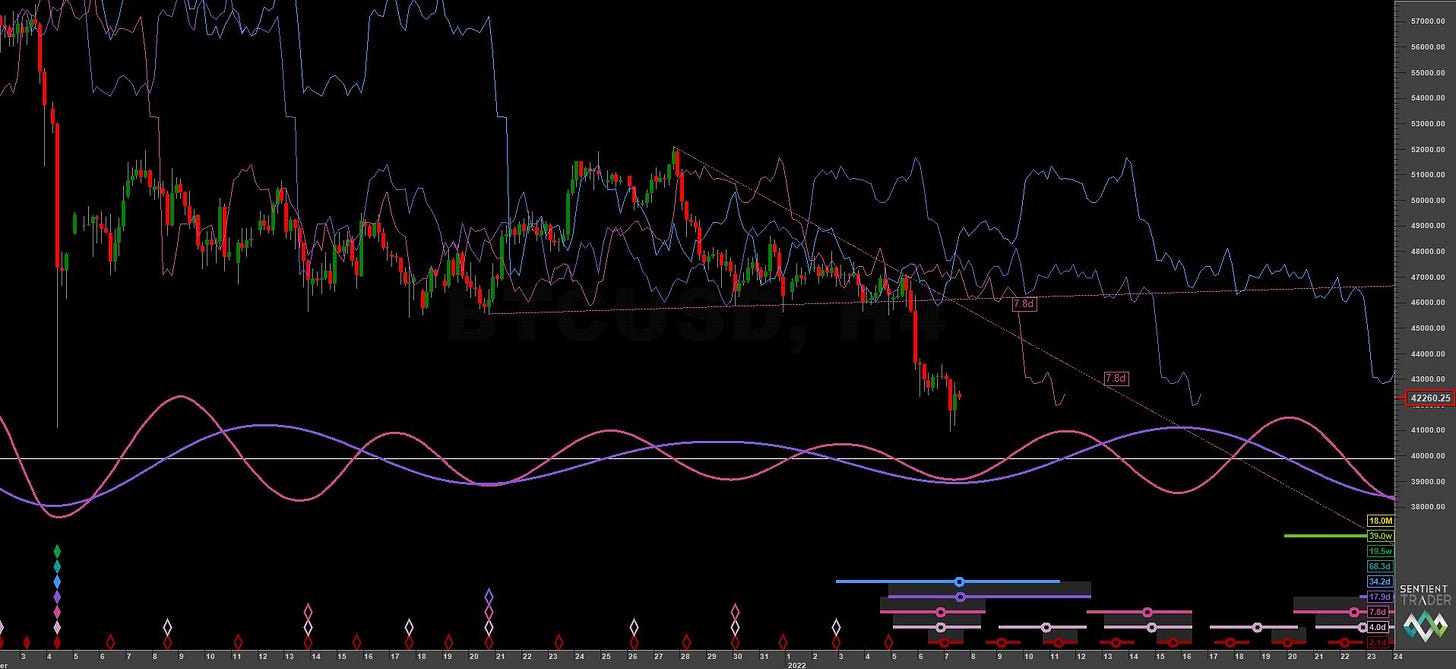
Components around the 80 day nominal cycle.

Summary
In the last report into Bitcoin on the 21st of December we noted the weakness of the initial move from the 20 week low:
The move from the 20 week low has been lacklustre so far, indicating a distinct uncertainty around cryptocurrency after a sharp fall to complete the 20 week component.
This weakness has now been compounded by the flat to bearish shape of the initial 40 day component, which is due to trough imminently. Price has come back to test the level of the phased 20 week nominal low at around 41000 and we must now start to assume sigma-l is becoming bearish. For an 18 month component, which troughed in July last year, to exhibit such a lacklustre move from the first 20 week component trough is unusual. We must now watch this next 40 day component which should be more bearish than the first after the initial move back up in the coming weeks.
The next 80 day nominal low is due at the start of February and we will look to take advantage of that in due course.
Price targets, even after being revised down were not met in the first 40 day component. Whilst price did move up through the 20 day FLD, triggering our entries, the area around 50000 was the zenith for price before a good move down in the ‘D’ category interaction and the 40 day nominal low:
For this reason the previous price target of 68000 should be adjusted to 55000-60000, around the resistance at the 80 day and 20 week FLDs.
Bitcoin’s phasing analysis defines the the majority of periodic functions in the other cryptocurrency instruments and some, such as Ethereum, have significantly breached the 20 week nominal low. This is expected as the relative amplitude of the 20 week component is higher than Bitcoin. Amplitude applies in both directions of a periodic component!
Trading Strategy
Interaction Status
Interaction stage of price in the FLD Trading Strategy (Advanced) which looks at an idealised 40 week cycle and an array of 3 FLD signal cycles. We apply the instrument’s phasing to the model and arrive at an overall summary for the interactions with the 20 day FLD, current and forthcoming.
Sigma-L recommendation: Risk Buy
Entry: Cross of 2 or 5 day FLD (risk on) / 10 day VTL
Stop: Below 40 day nominal trough (to be confirmed)
Target: 47000-48000
Reference 20 Day FLD Interaction: E3
At this stage of the 40 week idealised cycle above the E3 trade is classified as a ‘neutral’. We have downgraded it to ‘risk buy’ on account of an assumed more bearish sigma-l (underlying trend). Risk on trade entries could be either the 2 or 5 day FLDs (shown in short term 4 hour chart). Targeting the 40 day FLD at around 47k - 48k
Assuming the phasing is accurate, focus should be on the next move down to the 80 day nominal low in early February.
FLD Settings
If you do not have the use of Sentient Trader use these settings to plot FLDs in your trading software (daily scale) to more easily follow trading signals and strategy from Sigma-L.
Make sure to account for non-trading days if your broker omits them in the data feed (weekends, for example). The below offsets are given with no added calculation for non-trading days.
80 day nominal: 63.5 days | 32 day FLD offset
40 day nominal: 33.2 days | 17 day FLD offset
20 day nominal: 16.5 days | 8 day FLD offset
10 day nominal: 8.3 days | 4 day FLD offset


