

Anatomy of a Trade: Natural Gas
In this second edition we look at a short trade in Natural Gas which occurred during November and December 2021.

The Setup
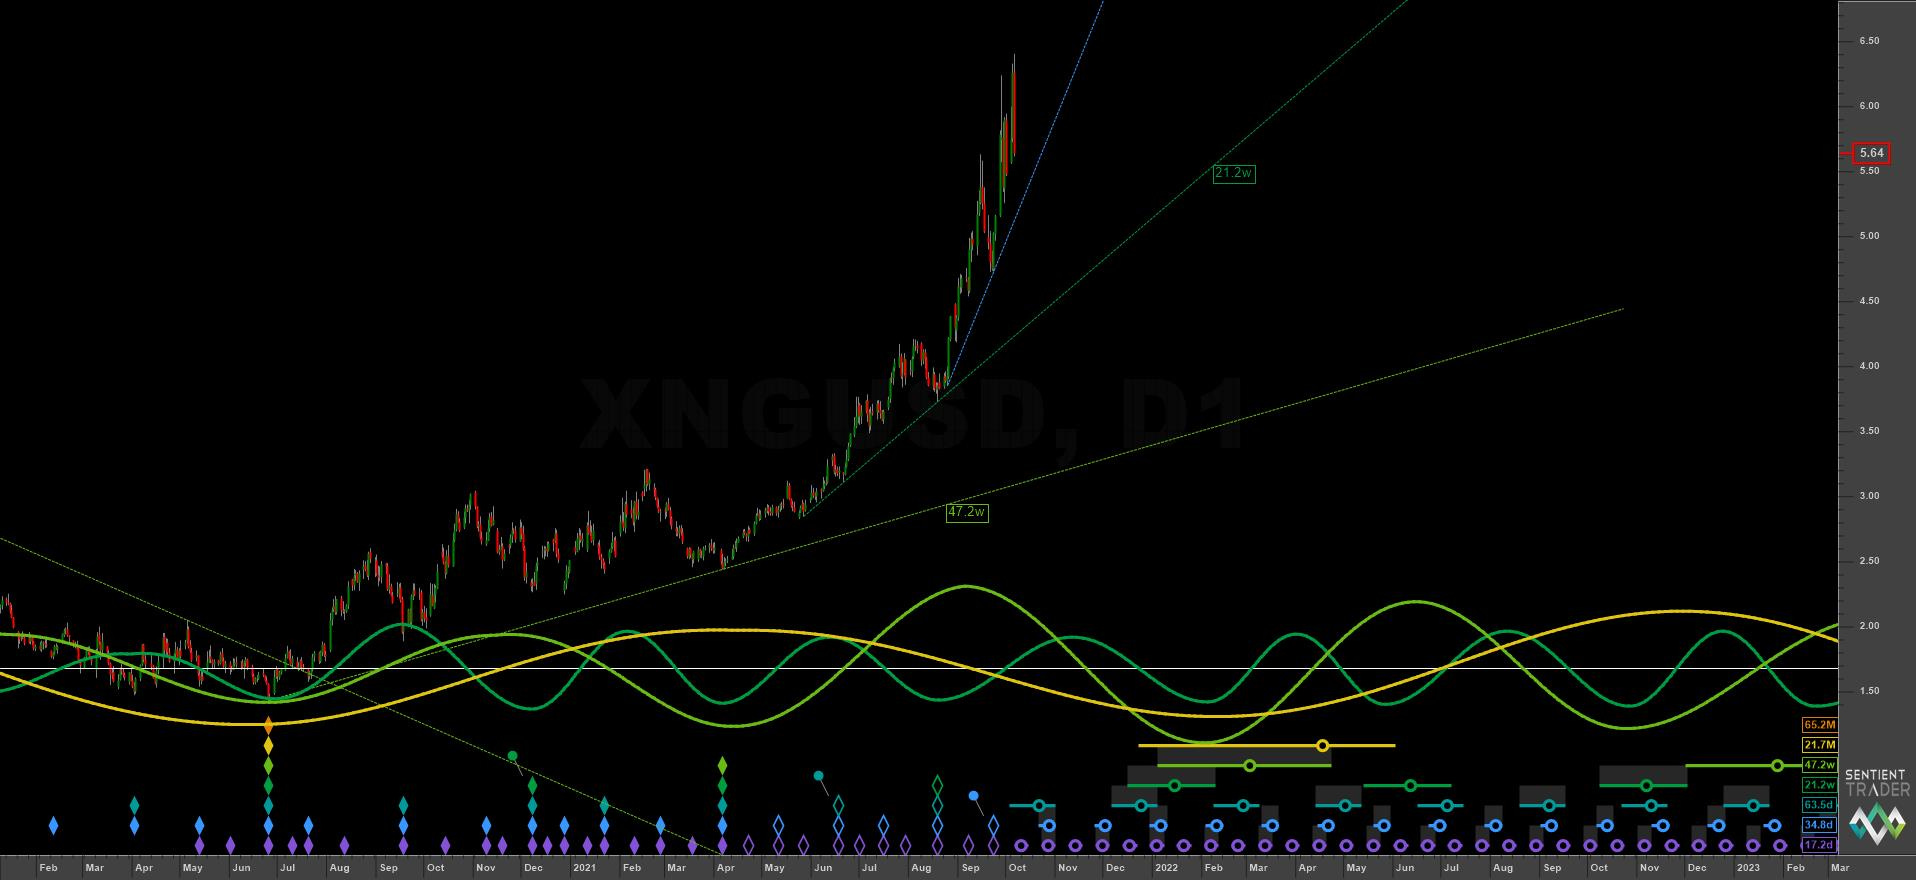
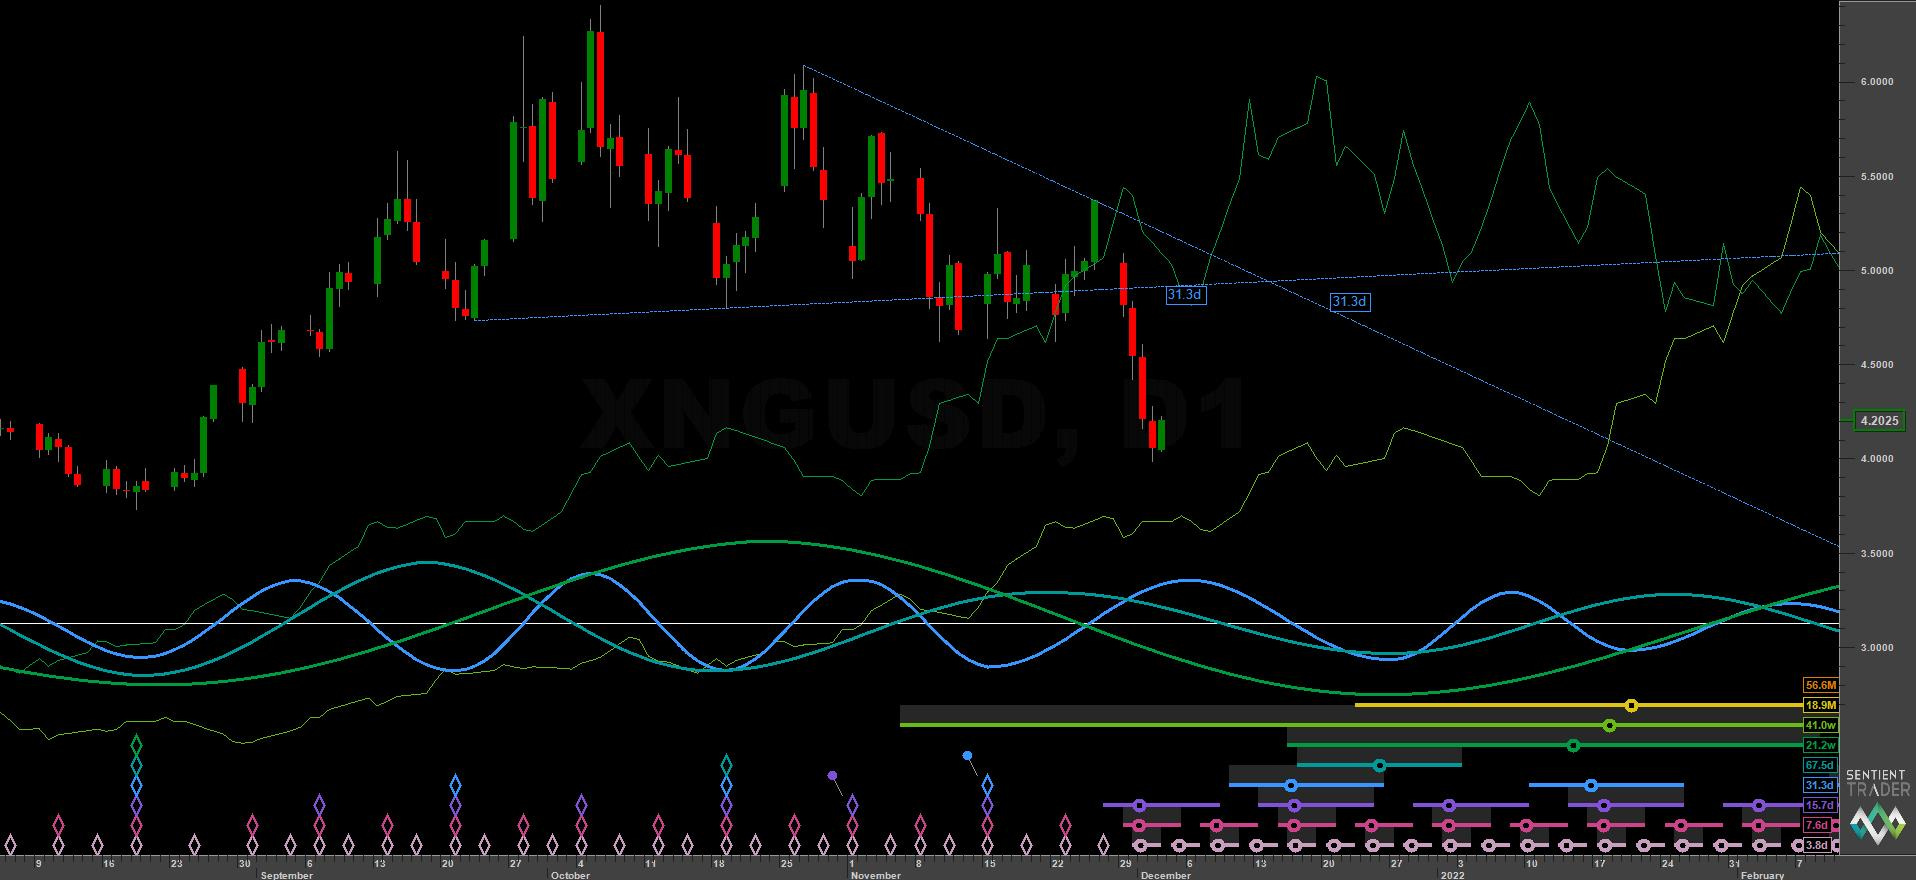
Although the main enactment of the short trade we are examining here came in November 2021 every trade must have some kind of context and supporting underlying trend (Sigma-L) to assist in entry. The longer term phasing in natural gas had suggested as early as September 2021 that the 18 month component was peaking.


At this point confirmation of that peak was likely going to be given by a cross of the 40 day VTL (blue), implying a peak of 80 day magnitude had occurred and, by the principle of synchronicity, the 20 week, 40 week and 18 month components.
It is worth noting that risk on traders could well have entered here on a shorter timeframe VTL or FLD for the main move to the 18 month low due late 2021 / early 2022 but there is a caveat.
We are looking to not only maximise profitable trades but also to maximise efficient use of capital in Hurst cycles.
It was likely, given the amplitude of the 80 day component, that the next low, due mid October 2021 would provide a sharp rally upward. As we are interested in the main move down to the 18 month low it would be inefficient to allocate part of our portfolio at this point. We would, instead, be looking to enter at the move to the first 40 day low of the 80 day cycle, likely to kick off the main move down.
Although overall in this particular instrument we may have made more profit entering earlier, a portfolio based approach that prioritises maximising capital allocation aswell as price timing is more beneficial as a whole.
To this end the 80 day VTL, shown above in light blue, was the perfect Hurstonian entry point for the move to the 18 month low, given that it would further confirm the 20 week peak had occurred and related larger degree cycle crests.
Entry Criteria and Targets
Entry: 80 Day VTL ($5.34)
Target: 40 week FLD / 20 week FLD cross target - both around $4
Stop: Above 80 day nominal peak circa $6
Trade
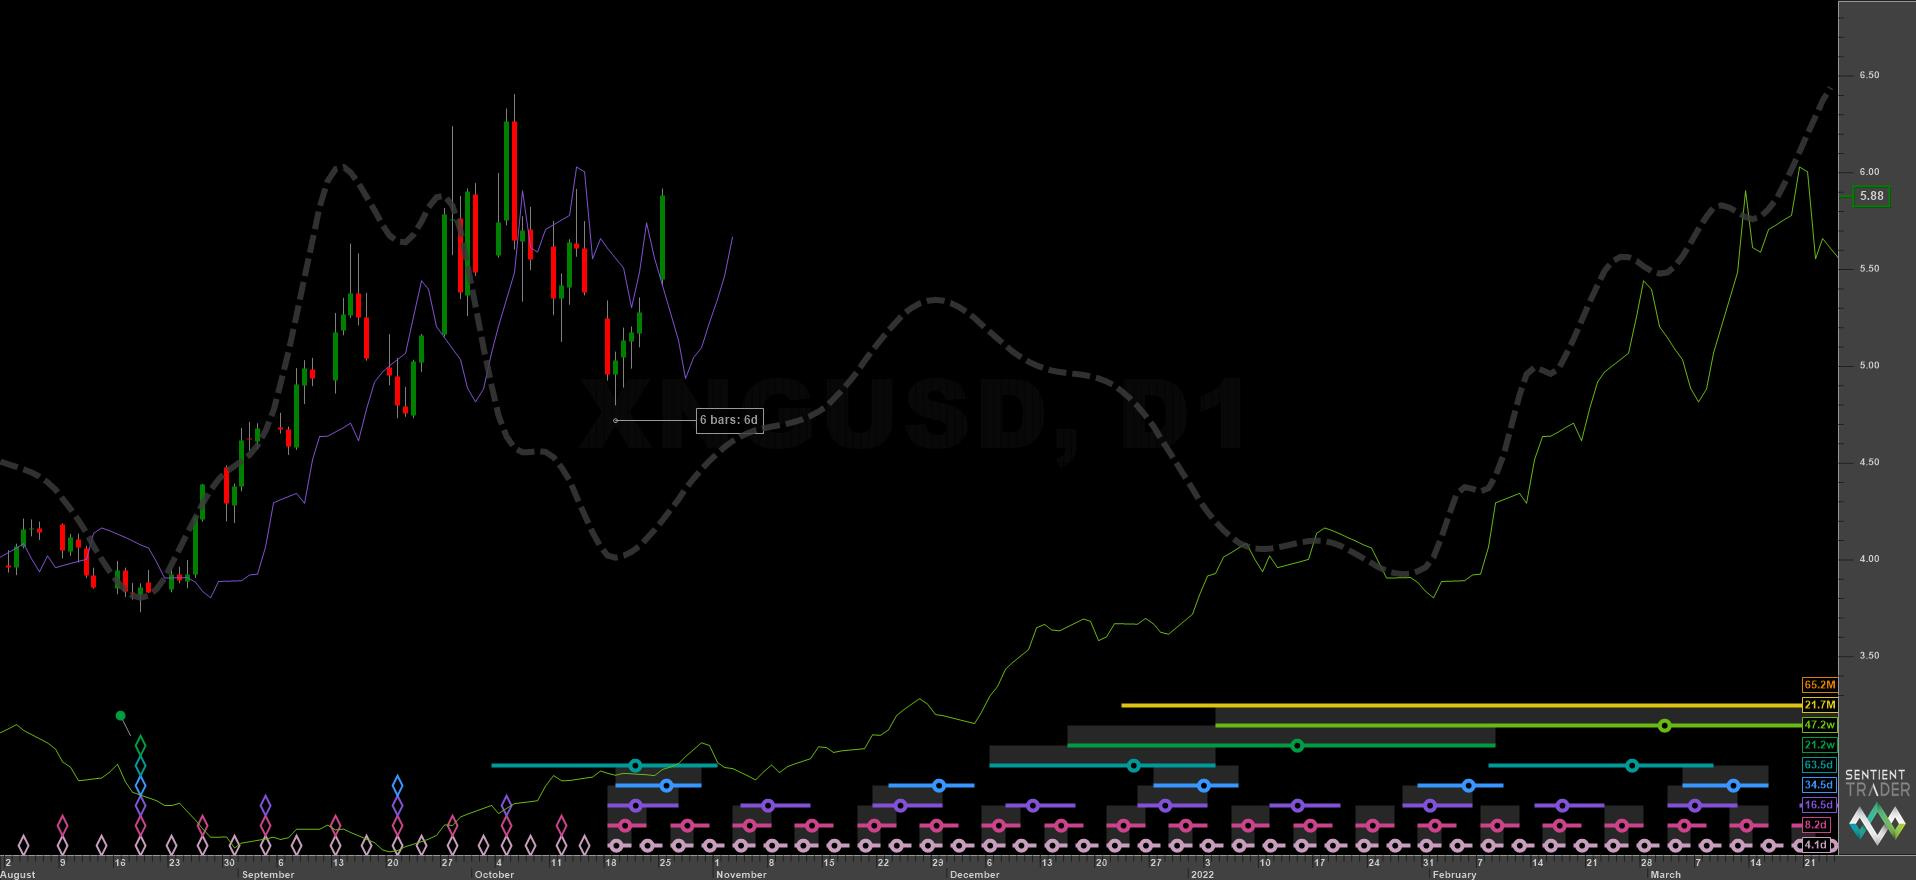
After the initial 80 day upward move of mid-late October, price slumped to the 20 day nominal low at the start of November and bounced again, notifying us to be ready for the cross of the 80 day VTL, also being within the ‘D’ category 20 day FLD interaction. It came on November the 8th at a price of $5.34. We could expect price to move down to the 20 week FLD support for the 40 day low and subsequent to that, a collapse to targets around 4 for the 18 month nominal low

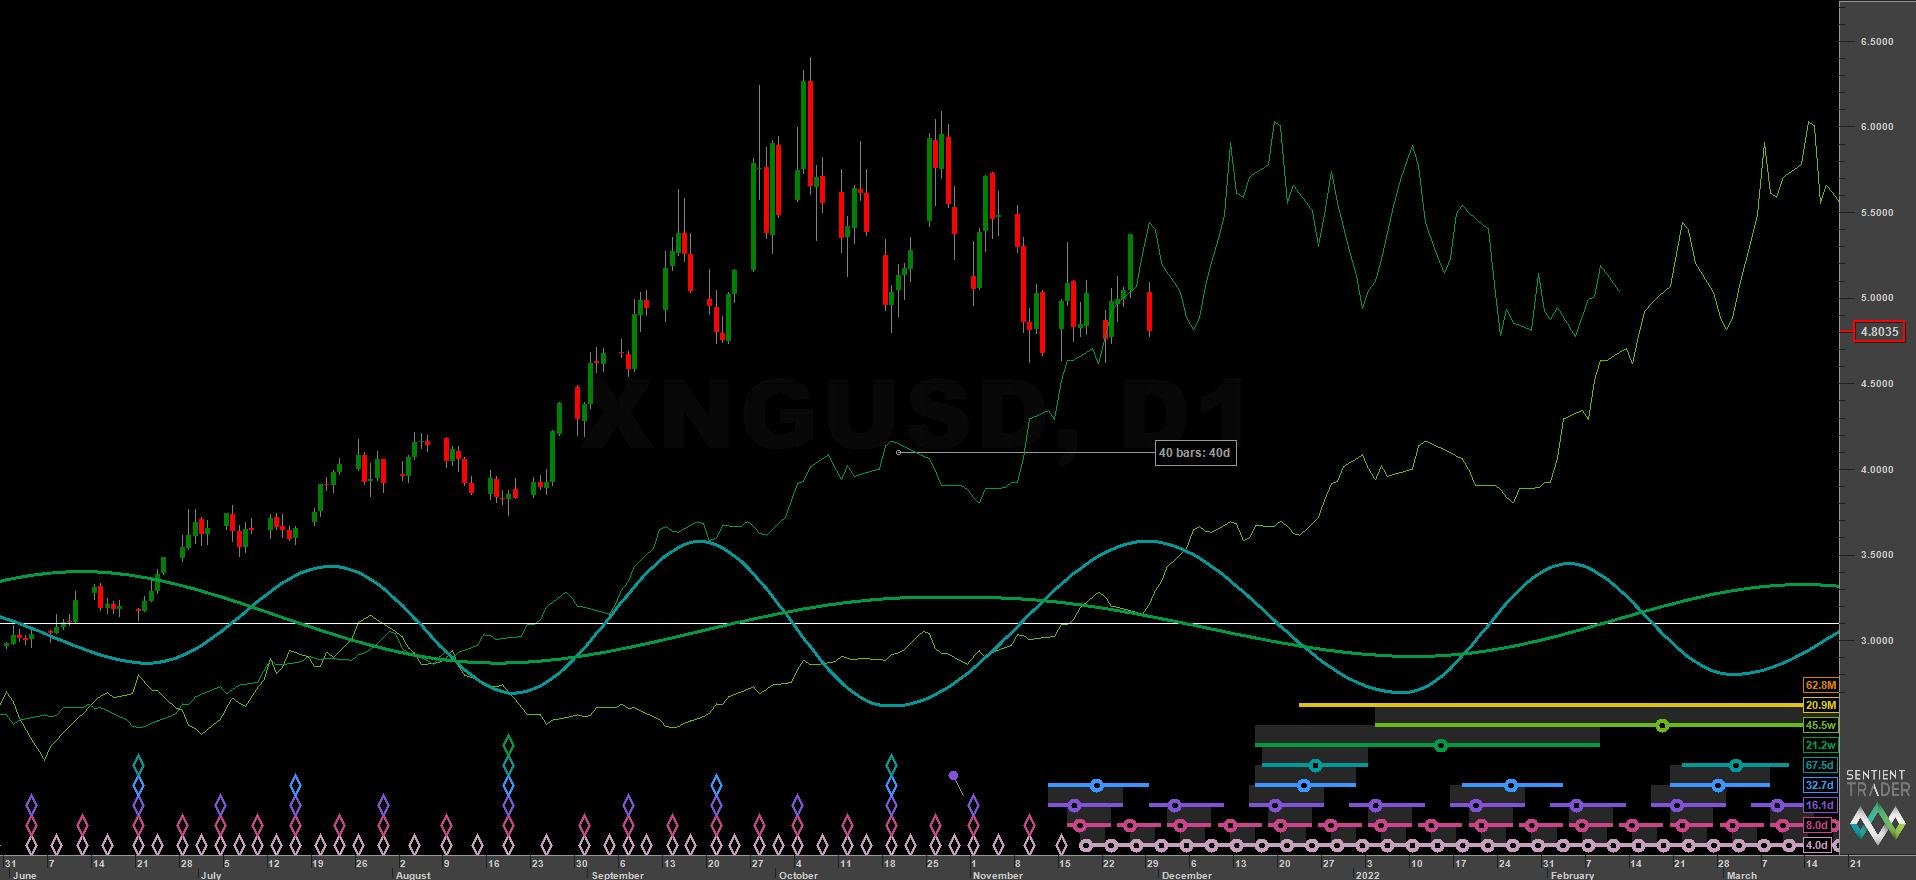
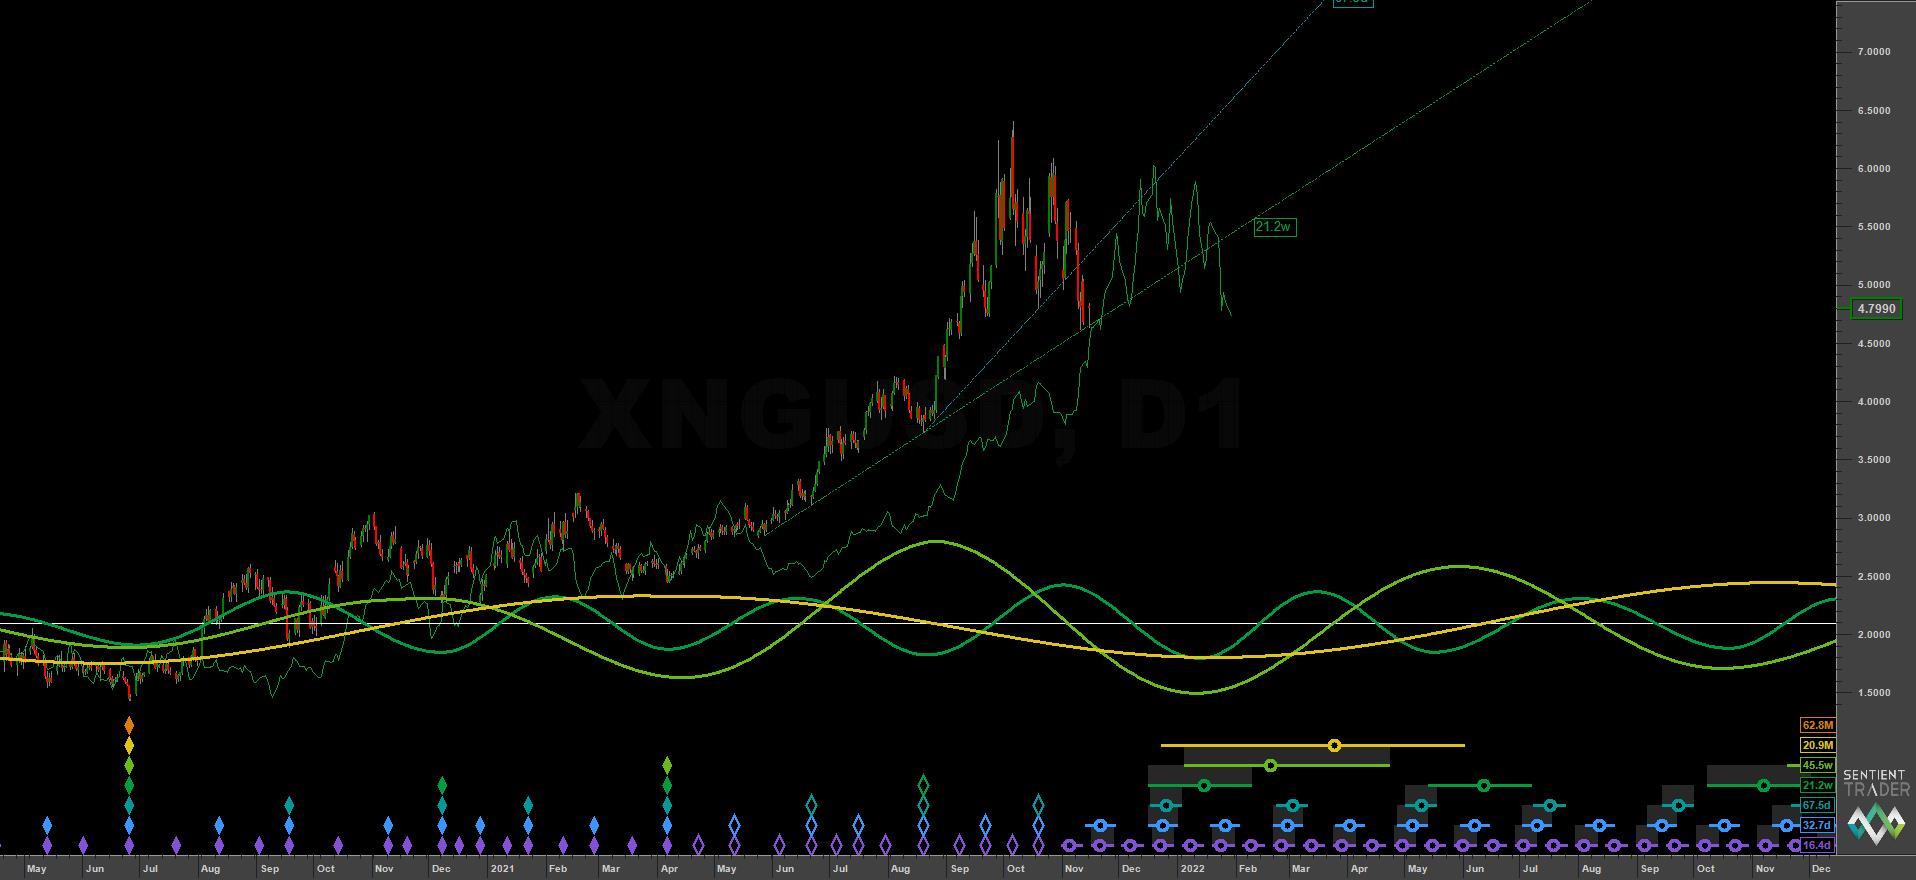
Price moved sideways for a week or so with support at the 20 week FLD before collapsing through it on the last weekend of November. This expected sideways movement was well received as it reflects an accurate phasing analysis if price reacts so crisply with an FLD. It reveals minimal frequency modulation at nowtime and subsequently provided us with a target of 3.909 for the 20 week FLD cross, shown above. Keen traders will note we could also have entered at the 20 week FLD cross in addition to the 80 day VTL cross, further enhancing efficient allocation of capital and yield over time.
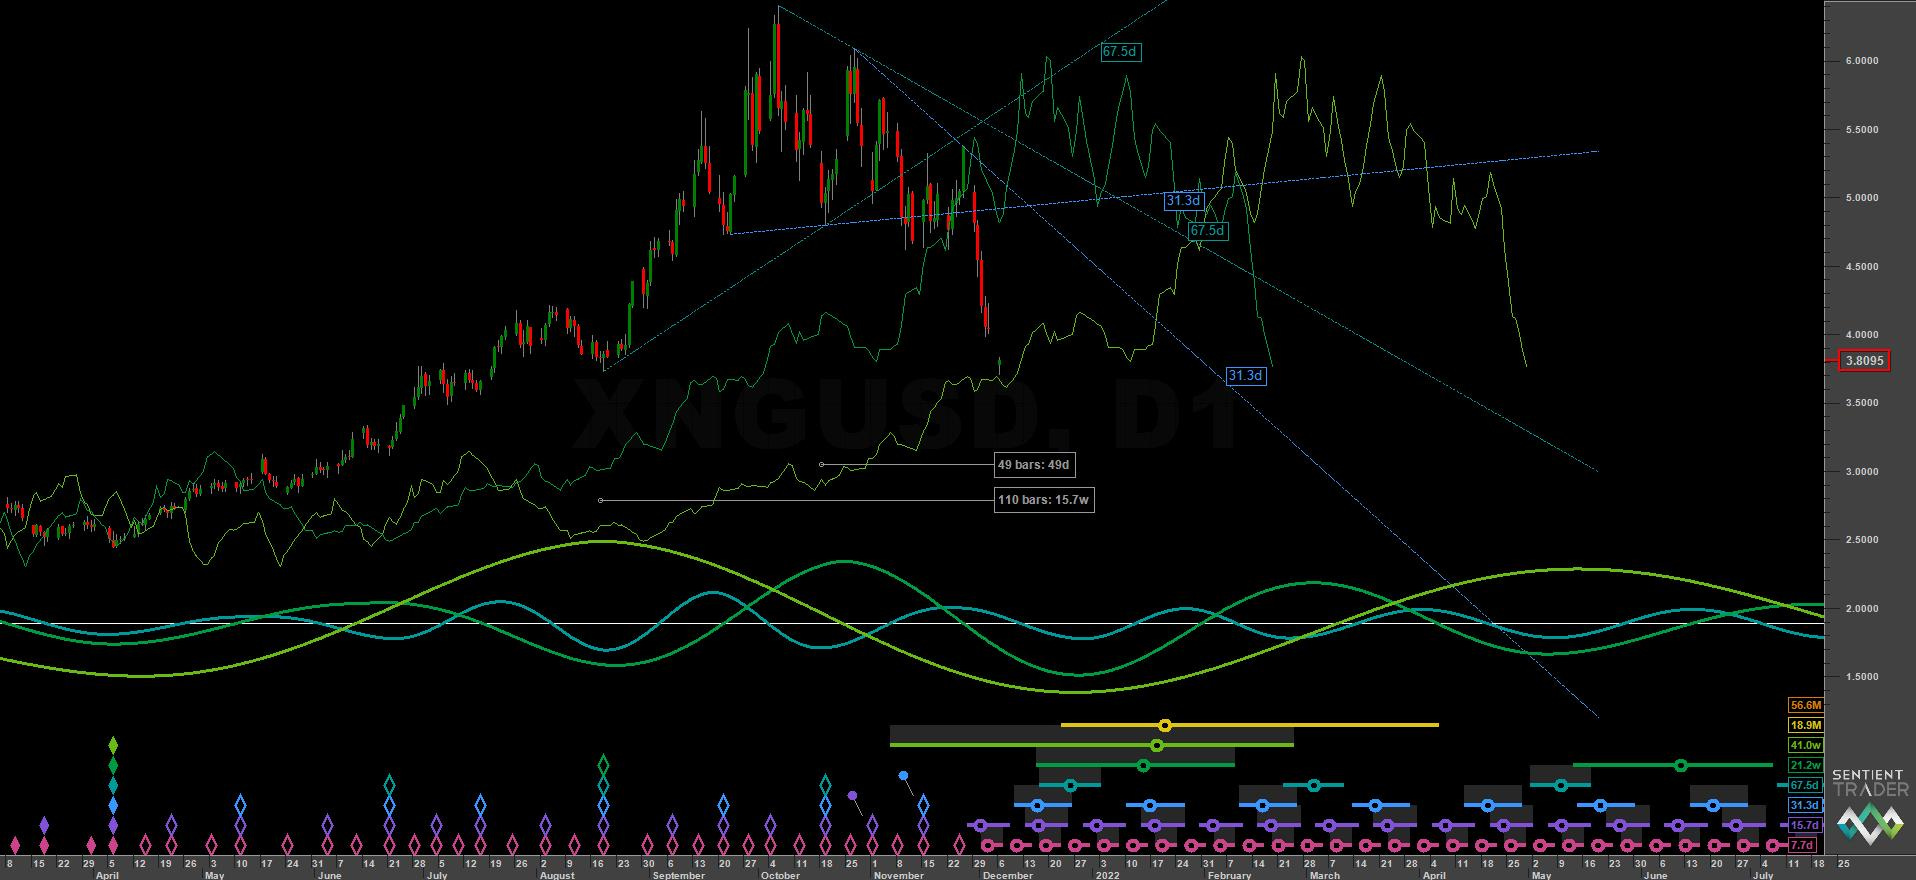
Price moved down sharply for the remainder of the trade, hitting the 20 week FLD cross target of 3.909 in the first week of December, an excellent circa 25% gain overall for subscribers.
Price could now be expected to be supported around the 40 week FLD prior to the next move up from the 18 month nominal low, hopefully to be written about later in 2022 for another edition of Anatomy of a Trade!
Summary
This trade in Natural Gas futures was excellent and really a textbook example of entry with an eye on maximising yield over time. We entered via cyclic tools (the 80 day FLD), managed targets with notes taken on FLD crosses (20 week FLD cross) and noted dynamic support/resistance areas in the trade via FLDs (20 week / 40 week).
For crucial, timely updates on these trading signals and others, join us today!